

Anomalous diffusion of single particles in cytoplasm
- PMID: 23601312
- PMCID: PMC3627875
- DOI: 10.1016/j.bpj.2013.01.049
Anomalous diffusion of single particles in cytoplasm
Abstract
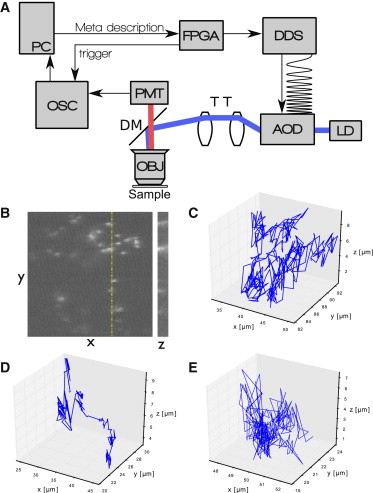
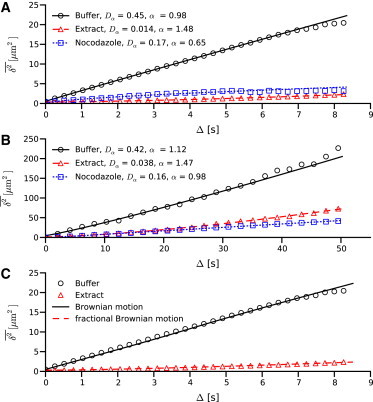
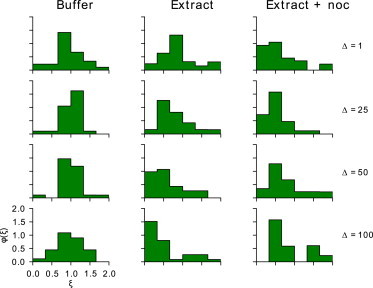
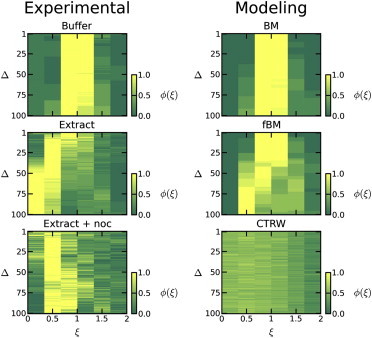
The crowded intracellular environment poses a formidable challenge to experimental and theoretical analyses of intracellular transport mechanisms. Our measurements of single-particle trajectories in cytoplasm and their random-walk interpretations elucidate two of these mechanisms: molecular diffusion in crowded environments and cytoskeletal transport along microtubules. We employed acousto-optic deflector microscopy to map out the three-dimensional trajectories of microspheres migrating in the cytosolic fraction of a cellular extract. Classical Brownian motion (BM), continuous time random walk, and fractional BM were alternatively used to represent these trajectories. The comparison of the experimental and numerical data demonstrates that cytoskeletal transport along microtubules and diffusion in the cytosolic fraction exhibit anomalous (nonFickian) behavior and posses statistically distinct signatures. Among the three random-walk models used, continuous time random walk provides the best representation of diffusion, whereas microtubular transport is accurately modeled with fractional BM.
Copyright © 2013 Biophysical Society. Published by Elsevier Inc. All rights reserved.
Figures
Similar articles
-
Meaningful interpretation of subdiffusive measurements in living cells (crowded environment) by fluorescence fluctuation microscopy.Curr Pharm Biotechnol. 2010 Aug;11(5):527-43. doi: 10.2174/138920110791591454. Curr Pharm Biotechnol. 2010. PMID: 20553227 Free PMC article.
-
Elucidating the Origin of Heterogeneous Anomalous Diffusion in the Cytoplasm of Mammalian Cells.Phys Rev Lett. 2020 Jul 31;125(5):058101. doi: 10.1103/PhysRevLett.125.058101. Phys Rev Lett. 2020. PMID: 32794890
-
Single-Particle Diffusion Characterization by Deep Learning.Biophys J. 2019 Jul 23;117(2):185-192. doi: 10.1016/j.bpj.2019.06.015. Epub 2019 Jun 22. Biophys J. 2019. PMID: 31280841 Free PMC article.
-
Anomalous transport in the crowded world of biological cells.Rep Prog Phys. 2013 Apr;76(4):046602. doi: 10.1088/0034-4885/76/4/046602. Epub 2013 Mar 12. Rep Prog Phys. 2013. PMID: 23481518 Review.
-
Mechanisms underlying anomalous diffusion in the plasma membrane.Curr Top Membr. 2015;75:167-207. doi: 10.1016/bs.ctm.2015.03.002. Epub 2015 Apr 15. Curr Top Membr. 2015. PMID: 26015283 Review.
Cited by
-
Exploring non-equilibrium processes and spatio-temporal scaling laws in heated egg yolk using coherent X-rays.Nat Commun. 2023 Sep 11;14(1):5580. doi: 10.1038/s41467-023-41202-z. Nat Commun. 2023. PMID: 37696830 Free PMC article.
-
Subtle changes in crosslinking drive diverse anomalous transport characteristics in actin-microtubule networks.Soft Matter. 2021 Apr 28;17(16):4375-4385. doi: 10.1039/d1sm00093d. Soft Matter. 2021. PMID: 33908593 Free PMC article.
-
RAF-like protein kinases mediate a deeply conserved, rapid auxin response.Cell. 2024 Jan 4;187(1):130-148.e17. doi: 10.1016/j.cell.2023.11.021. Epub 2023 Dec 20. Cell. 2024. PMID: 38128538 Free PMC article.
-
Size- and position-dependent cytoplasm viscoelasticity through hydrodynamic interactions with the cell surface.Proc Natl Acad Sci U S A. 2023 Feb 28;120(9):e2216839120. doi: 10.1073/pnas.2216839120. Epub 2023 Feb 21. Proc Natl Acad Sci U S A. 2023. PMID: 36802422 Free PMC article.
-
Crowding induces complex ergodic diffusion and dynamic elongation of large DNA molecules.Biophys J. 2015 Mar 10;108(5):1220-8. doi: 10.1016/j.bpj.2015.02.002. Biophys J. 2015. PMID: 25762333 Free PMC article.
References
-
- Khan S., Reese T.S., Shabbir A. Spatiotemporal maps of CaMKII in dendritic spines. J. Comput. Neurosci. 2012;33:123–139. - PubMed
-
- Minton A.P. The influence of macromolecular crowding and macromolecular confinement on biochemical reactions in physiological media. J. Biol. Chem. 2001;276:10577–10580. - PubMed
-
- Verkman A.S. Solute and macromolecule diffusion in cellular aqueous compartments. Trends Biochem. Sci. 2002;27:27–33. - PubMed
-
- Vale R.D. The molecular motor toolbox for intracellular transport. Cell. 2003;112:467–480. - PubMed
Publication types
MeSH terms
Grants and funding
LinkOut - more resources
Full Text Sources
Other Literature Sources
