

Stoichiometric relationship between Na(+) ions transported and glucose consumed in human erythrocytes: Bayesian analysis of (23)Na and (13)C NMR time course data
- PMID: 23601315
- PMCID: PMC3628572
- DOI: 10.1016/j.bpj.2013.03.019
Stoichiometric relationship between Na(+) ions transported and glucose consumed in human erythrocytes: Bayesian analysis of (23)Na and (13)C NMR time course data
Abstract
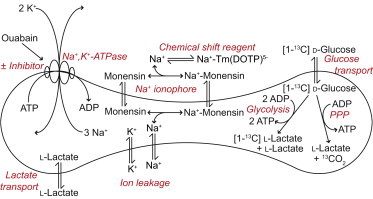
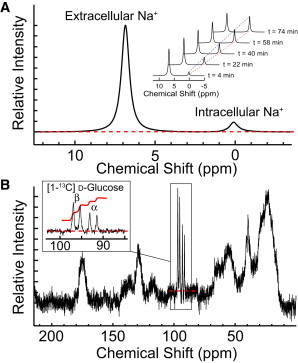
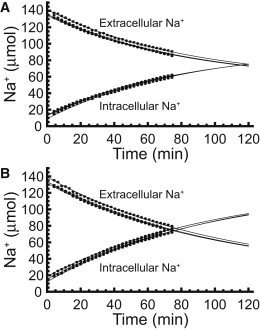
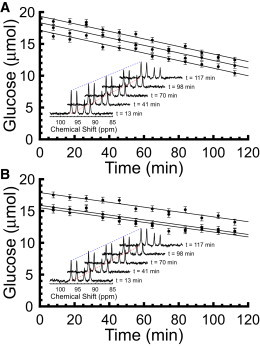
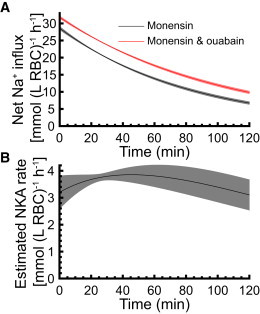
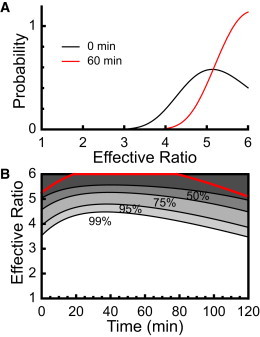
We examined the response of Na(+),K(+)-ATPase (NKA) to monensin, a Na(+) ionophore, with and without ouabain, an NKA inhibitor, in suspensions of human erythrocytes (red blood cells). A combination of (13)C and (23)Na NMR methods allowed the recording of intra- and extracellular Na(+), and (13)C-labeled glucose time courses. The net influx of Na(+) and the consumption of glucose were measured with and without NKA inhibited by ouabain. A Bayesian analysis was used to determine probability distributions of the parameter values of a minimalist mathematical model of the kinetics involved, and then used to infer the rates of Na(+) transported and glucose consumed. It was estimated that the numerical relationship between the number of Na(+) ions transported by NKA per molecule of glucose consumed by a red blood cell was close to the ratio 6.0:1.0, agreeing with theoretical prediction.
Copyright © 2013 Biophysical Society. Published by Elsevier Inc. All rights reserved.
Figures
Similar articles
-
Quantitative model of NMR chemical shifts of 23Na+ induced by TmDOTP: applications in studies of Na+ transport in human erythrocytes.J Inorg Biochem. 2012 Oct;115:211-9. doi: 10.1016/j.jinorgbio.2012.03.009. Epub 2012 Apr 21. J Inorg Biochem. 2012. PMID: 22658754
-
Monensin-Induced Increase in Intracellular Na+ Induces Changes in Na+ and Ca2+ Currents and Regulates Na+-K+ and Na+-Ca2+ Transport in Cardiomyocytes.Pharmacology. 2021;106(1-2):91-105. doi: 10.1159/000510576. Epub 2020 Oct 28. Pharmacology. 2021. PMID: 33113543
-
Astroglial cell death induced by excessive influx of sodium ions.Eur J Pharmacol. 2000 Nov 17;408(2):127-35. doi: 10.1016/s0014-2999(00)00790-1. Eur J Pharmacol. 2000. PMID: 11080518
-
Tubulin-Na+, K + -ATPase interaction: Involvement in enzymatic regulation and cellular function.J Cell Physiol. 2019 Jun;234(6):7752-7763. doi: 10.1002/jcp.27610. Epub 2018 Oct 30. J Cell Physiol. 2019. PMID: 30378111 Review.
-
[Interaction of sodium and potassium ions with Na+, K+-ATPase].Tanpakushitsu Kakusan Koso. 1984 Jun;29(6):455-68. Tanpakushitsu Kakusan Koso. 1984. PMID: 6091181 Review. Japanese. No abstract available.
Cited by
-
Membrane flickering of the human erythrocyte: constrained random walk used with Bayesian analysis.Eur Biophys J. 2014 May;43(4-5):157-67. doi: 10.1007/s00249-014-0951-3. Epub 2014 Mar 30. Eur Biophys J. 2014. PMID: 24682391
-
Disrupting Na+ ion homeostasis and Na+/K+ ATPase activity in breast cancer cells directly modulates glycolysis in vitro and in vivo.Cancer Metab. 2024 May 24;12(1):15. doi: 10.1186/s40170-024-00343-5. Cancer Metab. 2024. PMID: 38783368 Free PMC article.
-
Transmembrane exchange of hyperpolarized 13C-urea in human erythrocytes: subminute timescale kinetic analysis.Biophys J. 2013 Nov 5;105(9):1956-66. doi: 10.1016/j.bpj.2013.09.034. Biophys J. 2013. PMID: 24209840 Free PMC article.
-
Erythrocyte Glycolytic and Redox Metabolism Affects Muscle Oxygenation and Exercise Performance: A Randomized Double-Blind Crossover Study in Men.Sports Med. 2025 Jul 28. doi: 10.1007/s40279-025-02279-2. Online ahead of print. Sports Med. 2025. PMID: 40719977
-
Membrane flickering of the human erythrocyte: physical and chemical effectors.Eur Biophys J. 2014 May;43(4-5):169-77. doi: 10.1007/s00249-014-0952-2. Epub 2014 Mar 26. Eur Biophys J. 2014. PMID: 24668224
References
-
- Grimes A.J. Blackwell; Oxford, UK: 1980. Human Red Cell Metabolism.
-
- Maretzki D., Klatt D., Rapoport S. ATP utilizing reactions of human erythrocyte membranes and the influence of modulator proteins. Acta Biol. Med. Ger. 1981;40:479–486. - PubMed
-
- Lingrel J.B., Kuntzweiler T. Na+,K+-ATPase. J. Biol. Chem. 1994;269:19659–19662. - PubMed
-
- Bernhardt I., Ellory J.C. Springer Verlag; Berlin, Germany: 2003. Red Cell Membrane Transport in Health and Disease.
-
- Skou J.C. The identification of the sodium-potassium pump (Nobel lecture) Angew. Chem. 1998;37:2320–2328. - PubMed
Publication types
MeSH terms
Substances
LinkOut - more resources
Full Text Sources
Other Literature Sources
