

Actin assembly factors regulate the gelation kinetics and architecture of F-actin networks
- PMID: 23601318
- PMCID: PMC3628567
- DOI: 10.1016/j.bpj.2013.01.017
Actin assembly factors regulate the gelation kinetics and architecture of F-actin networks
Abstract
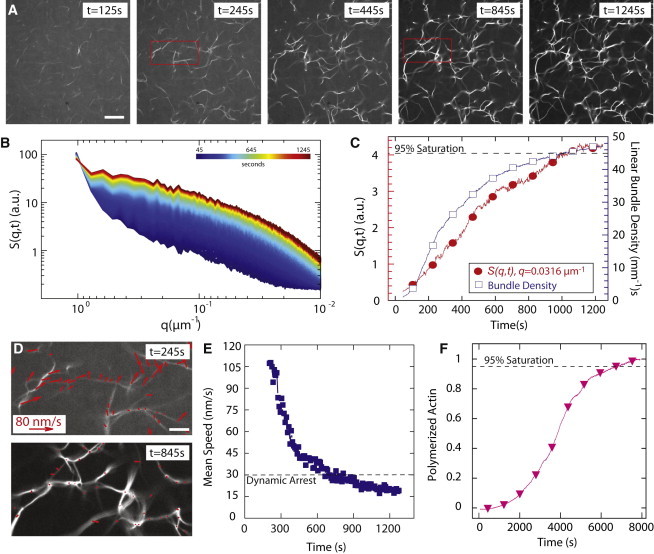
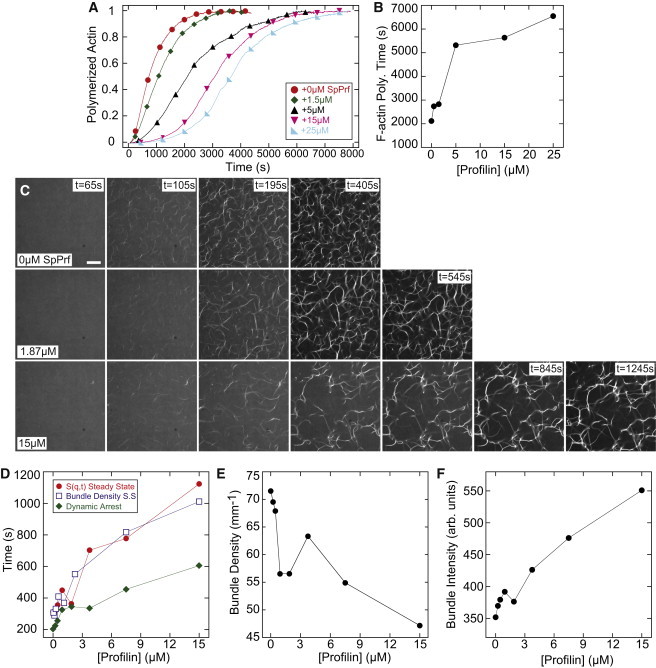
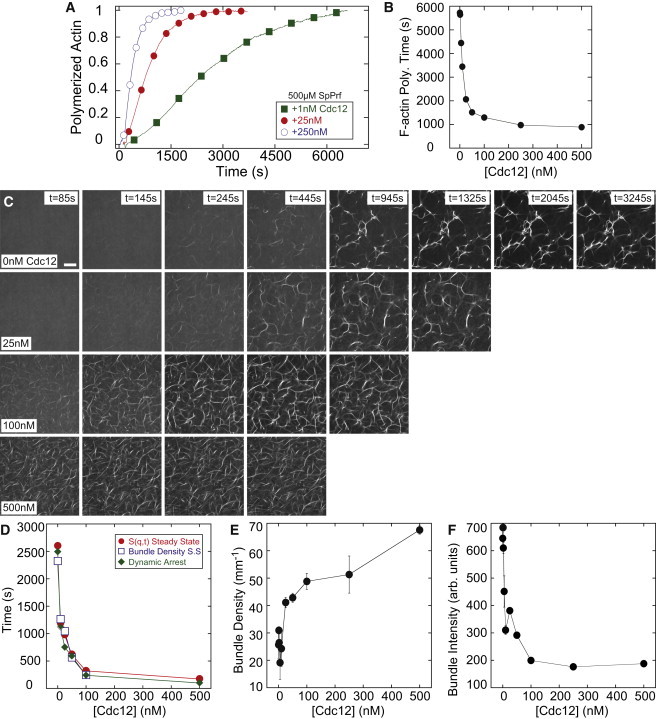
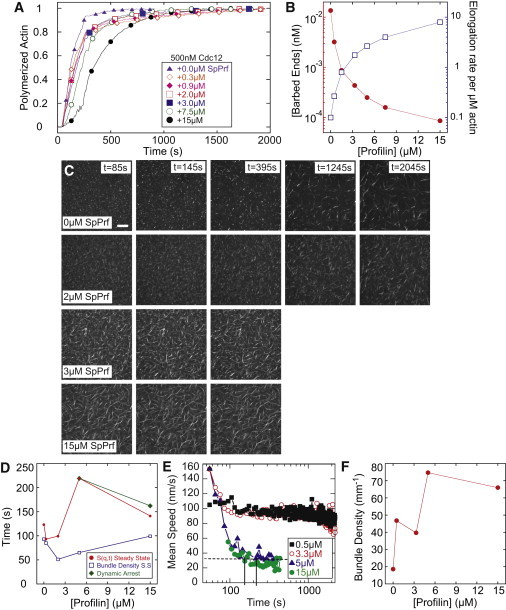
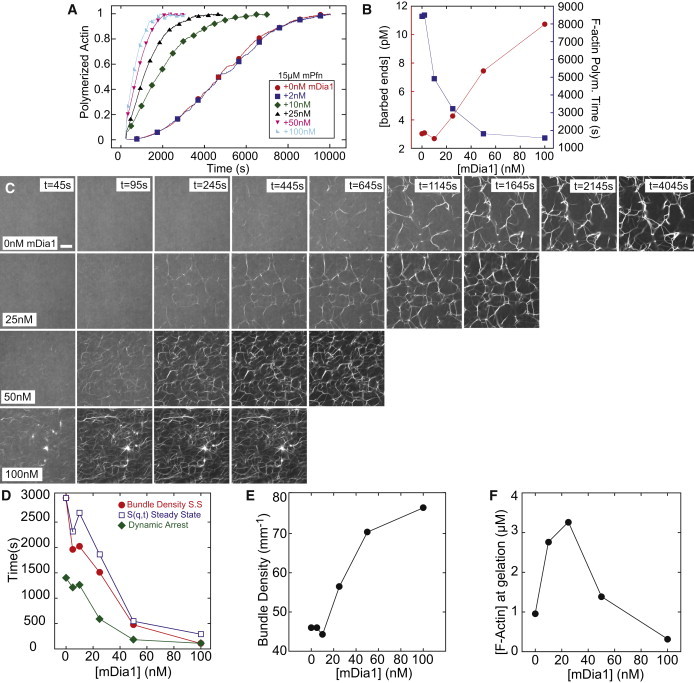
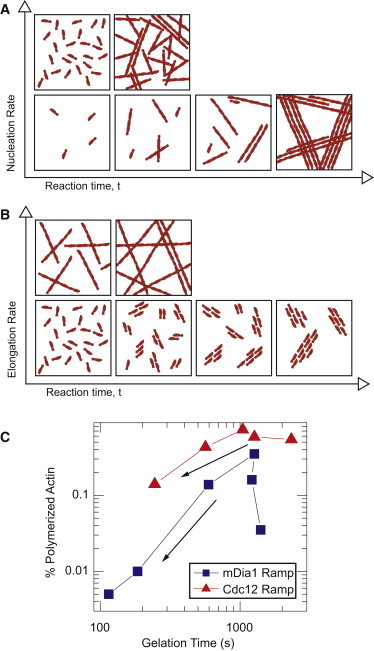
Dynamic regulation of the actin cytoskeleton is required for diverse cellular processes. Proteins regulating the assembly kinetics of the cytoskeletal biopolymer F-actin are known to impact the architecture of actin cytoskeletal networks in vivo, but the underlying mechanisms are not well understood. Here, we demonstrate that changes to actin assembly kinetics with physiologically relevant proteins profilin and formin (mDia1 and Cdc12) have dramatic consequences on the architecture and gelation kinetics of otherwise biochemically identical cross-linked F-actin networks. Reduced F-actin nucleation rates promote the formation of a sparse network of thick bundles, whereas increased nucleation rates result in a denser network of thinner bundles. Changes to F-actin elongation rates also have marked consequences. At low elongation rates, gelation ceases and a solution of rigid bundles is formed. By contrast, rapid filament elongation accelerates dynamic arrest and promotes gelation with minimal F-actin density. These results are consistent with a recently developed model of how kinetic constraints regulate network architecture and underscore how molecular control of polymer assembly is exploited to modulate cytoskeletal architecture and material properties.
Copyright © 2013 Biophysical Society. Published by Elsevier Inc. All rights reserved.
Figures
Similar articles
-
Biphasic Effect of Profilin Impacts the Formin mDia1 Force-Sensing Mechanism in Actin Polymerization.Biophys J. 2017 Jul 25;113(2):461-471. doi: 10.1016/j.bpj.2017.06.012. Biophys J. 2017. PMID: 28746856 Free PMC article.
-
Mechanostress resistance involving formin homology proteins: G- and F-actin homeostasis-driven filament nucleation and helical polymerization-mediated actin polymer stabilization.Biochem Biophys Res Commun. 2018 Nov 25;506(2):323-329. doi: 10.1016/j.bbrc.2018.09.189. Epub 2018 Oct 9. Biochem Biophys Res Commun. 2018. PMID: 30309655 Review.
-
Using Microfluidics Single Filament Assay to Study Formin Control of Actin Assembly.Methods Mol Biol. 2018;1805:75-92. doi: 10.1007/978-1-4939-8556-2_4. Methods Mol Biol. 2018. PMID: 29971713
-
How profilin promotes actin filament assembly in the presence of thymosin beta 4.Cell. 1993 Dec 3;75(5):1007-14. doi: 10.1016/0092-8674(93)90544-z. Cell. 1993. PMID: 8252614
-
F-Actin Cytoskeleton Network Self-Organization Through Competition and Cooperation.Annu Rev Cell Dev Biol. 2020 Oct 6;36:35-60. doi: 10.1146/annurev-cellbio-032320-094706. Annu Rev Cell Dev Biol. 2020. PMID: 33021819 Free PMC article. Review.
Cited by
-
Filament Nucleation Tunes Mechanical Memory in Active Polymer Networks.Adv Funct Mater. 2019 Dec 5;29(49):1905243. doi: 10.1002/adfm.201905243. Epub 2019 Sep 25. Adv Funct Mater. 2019. PMID: 32523502 Free PMC article.
-
Emergent mechanics of actomyosin drive punctuated contractions and shape network morphology in the cell cortex.PLoS Comput Biol. 2018 Sep 17;14(9):e1006344. doi: 10.1371/journal.pcbi.1006344. eCollection 2018 Sep. PLoS Comput Biol. 2018. PMID: 30222728 Free PMC article.
-
Cell-sized spherical confinement induces the spontaneous formation of contractile actomyosin rings in vitro.Nat Cell Biol. 2015 Apr;17(4):480-9. doi: 10.1038/ncb3142. Epub 2015 Mar 23. Nat Cell Biol. 2015. PMID: 25799060
-
The dynamics of filament assembly define cytoskeletal network morphology.Nat Commun. 2016 Dec 21;7:13827. doi: 10.1038/ncomms13827. Nat Commun. 2016. PMID: 28000681 Free PMC article.
-
Cooperative bundling by fascin generates actin structures with architectures that depend on filament length.Front Cell Dev Biol. 2022 Sep 2;10:974047. doi: 10.3389/fcell.2022.974047. eCollection 2022. Front Cell Dev Biol. 2022. PMID: 36120572 Free PMC article.
References
-
- Kaksonen M., Toret C.P., Drubin D.G. Harnessing actin dynamics for clathrin-mediated endocytosis. Nat. Rev. Mol. Cell Biol. 2006;7:404–414. - PubMed
-
- Ridley A.J., Schwartz M.A., Horwitz A.R. Cell migration: integrating signals from front to back. Science. 2003;302:1704–1709. - PubMed
-
- Vavylonis D., Wu J.Q., Pollard T.D. Assembly mechanism of the contractile ring for cytokinesis by fission yeast. Science. 2008;319:97–100. - PubMed
Publication types
MeSH terms
Substances
Grants and funding
LinkOut - more resources
Full Text Sources
Other Literature Sources
