. 2013 Apr 15:108:123-30.
doi: 10.1016/j.talanta.2013.03.005. Epub 2013 Mar 13.

Sample preparation methodology for mouse heart metabolomics using comprehensive two-dimensional gas chromatography coupled with time-of-flight mass spectrometry

Affiliations

Sample preparation methodology for mouse heart metabolomics using comprehensive two-dimensional gas chromatography coupled with time-of-flight mass spectrometry

Luke C Marney et al. Talanta. .

Abstract

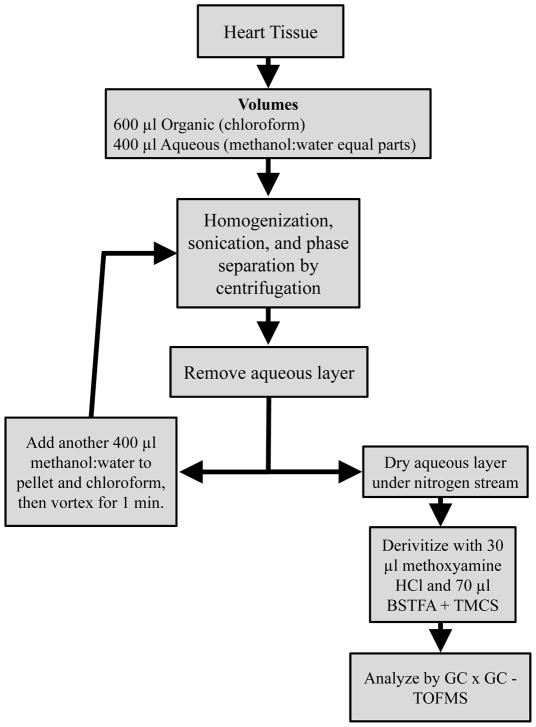
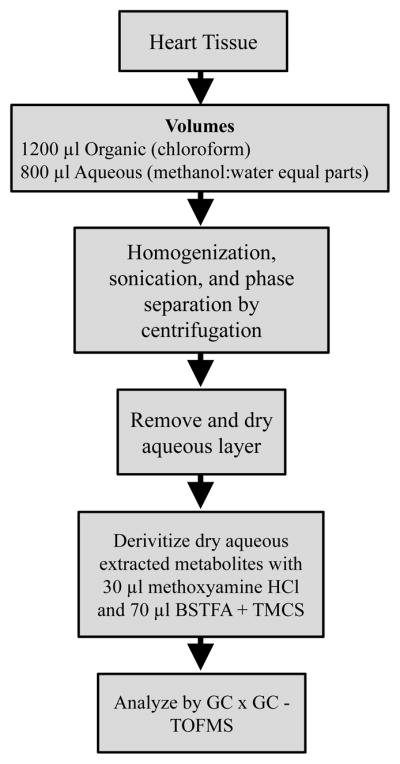
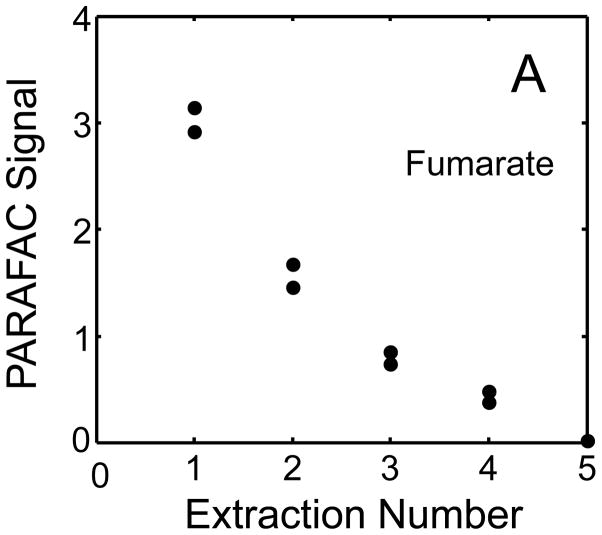
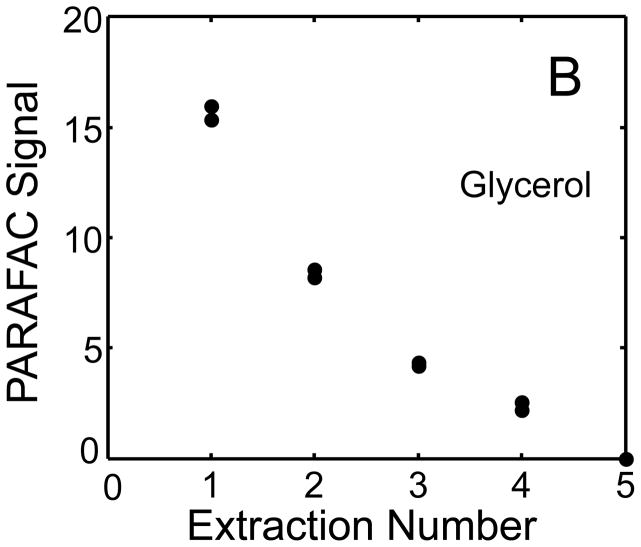
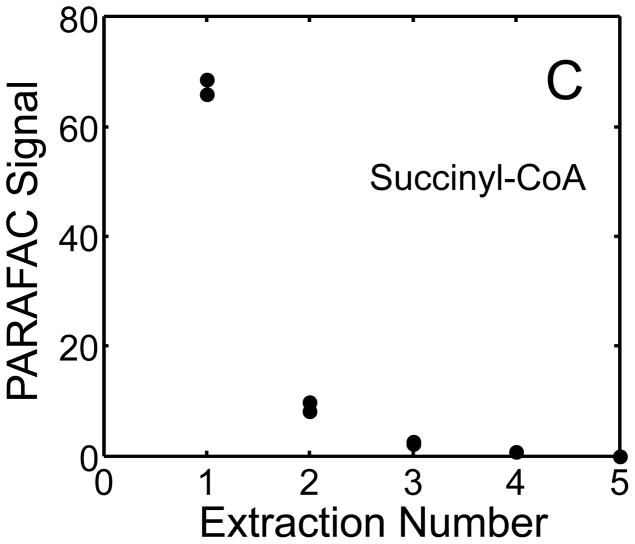
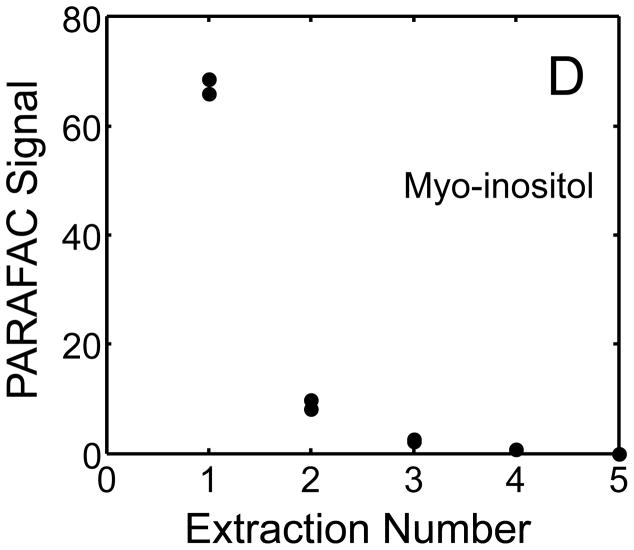
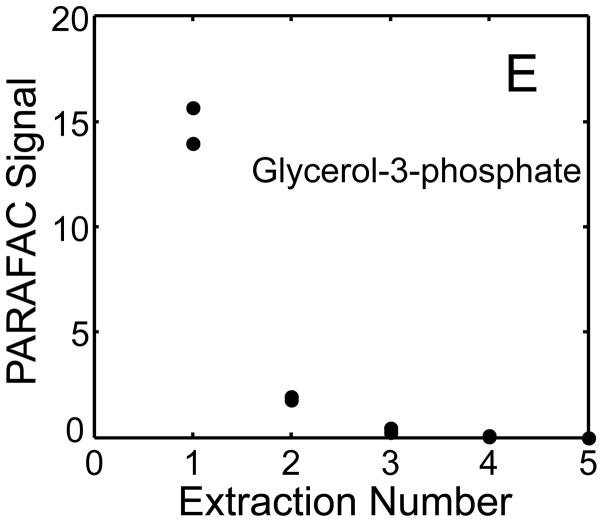
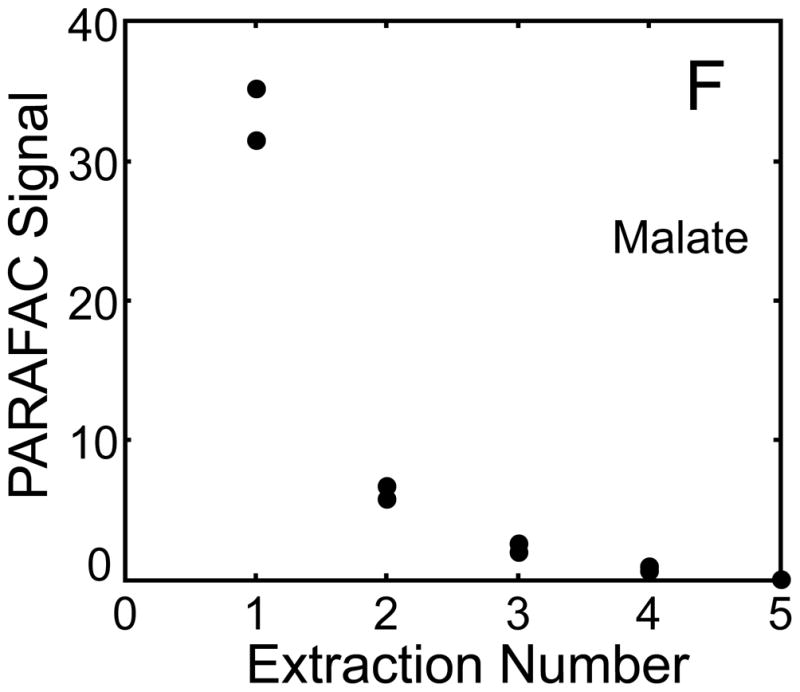
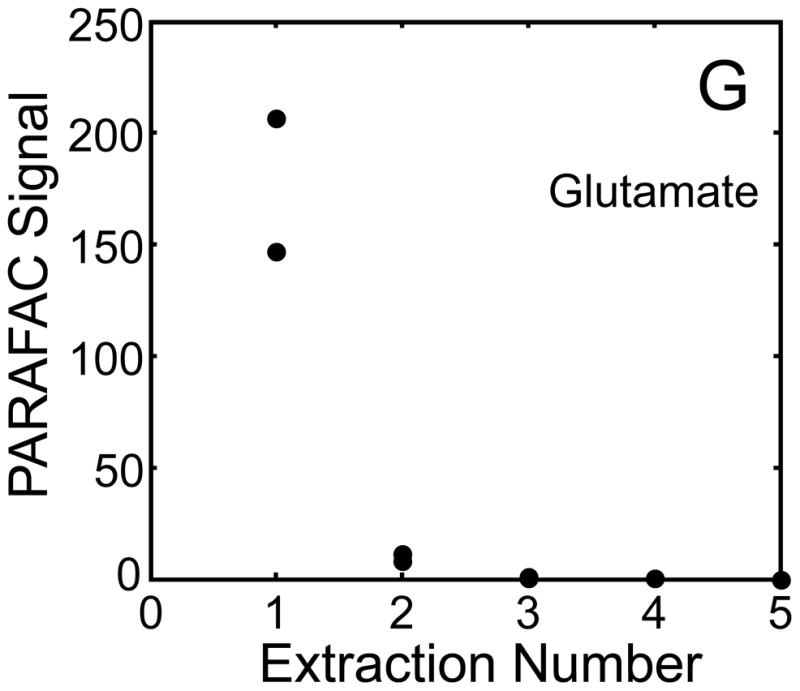
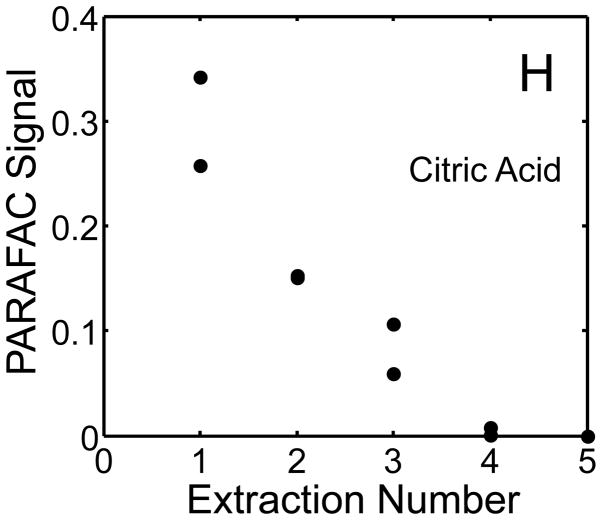
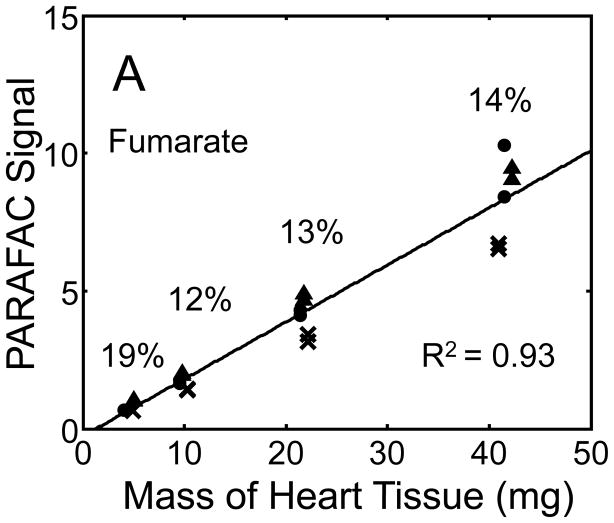
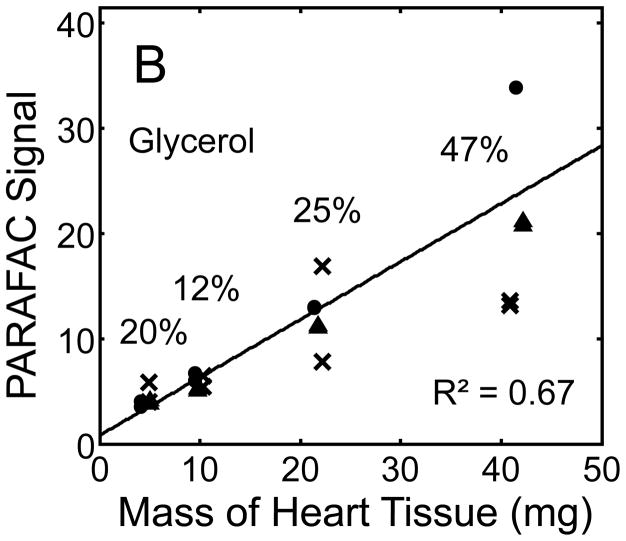
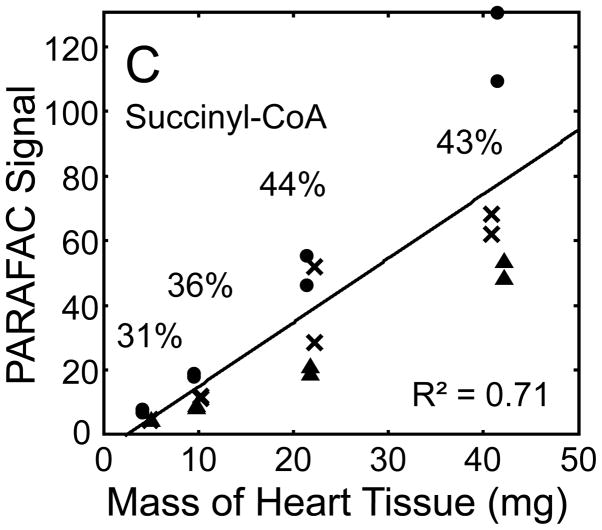
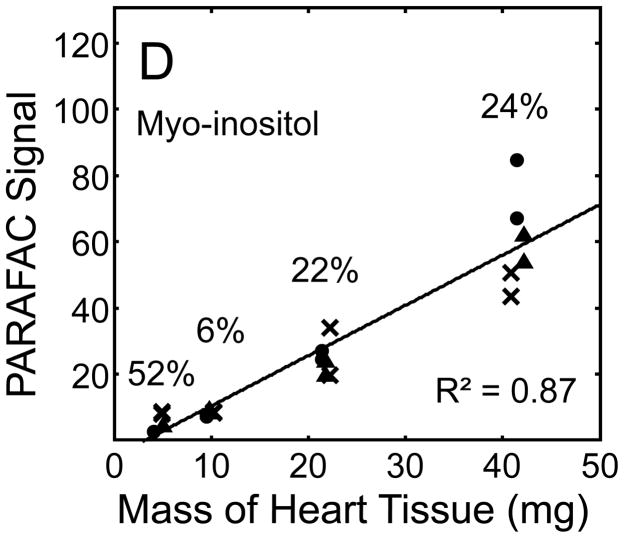
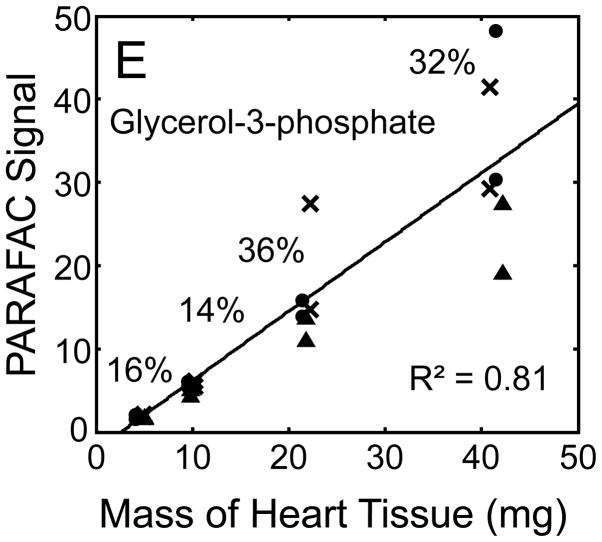
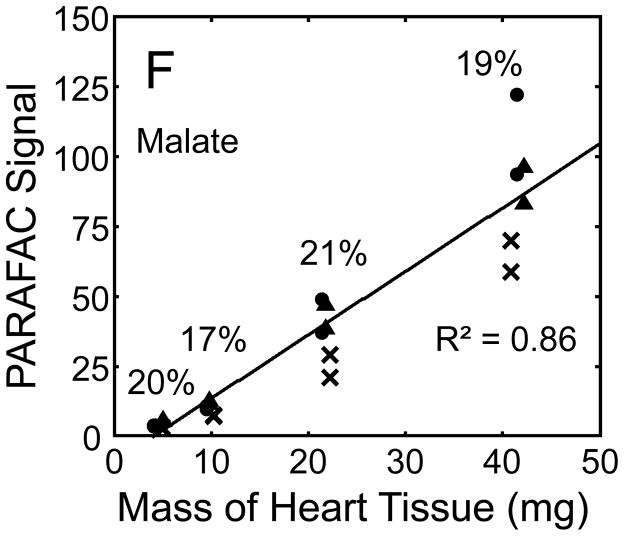
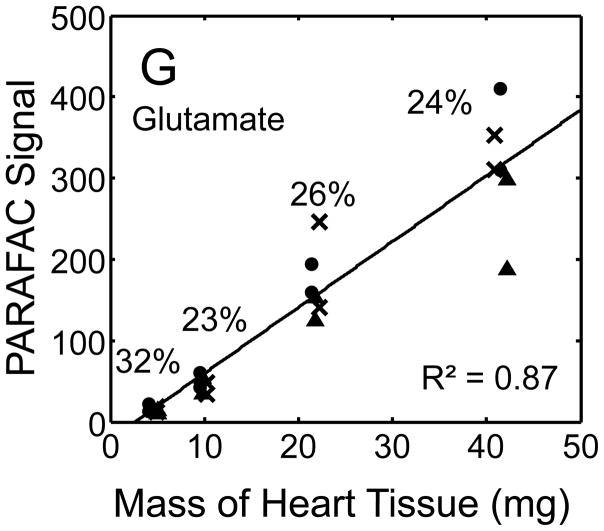
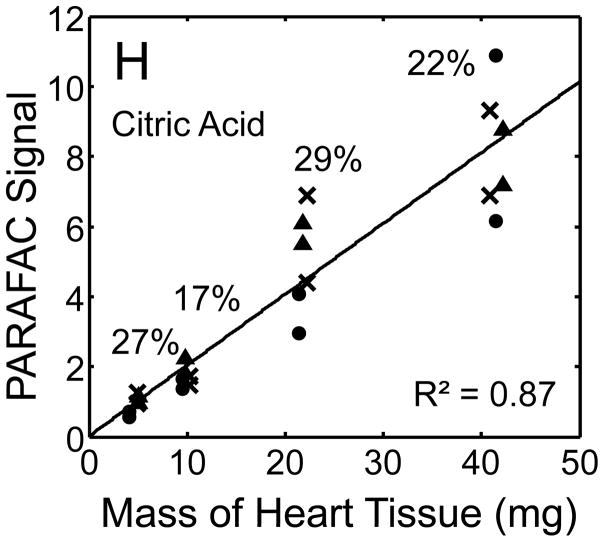
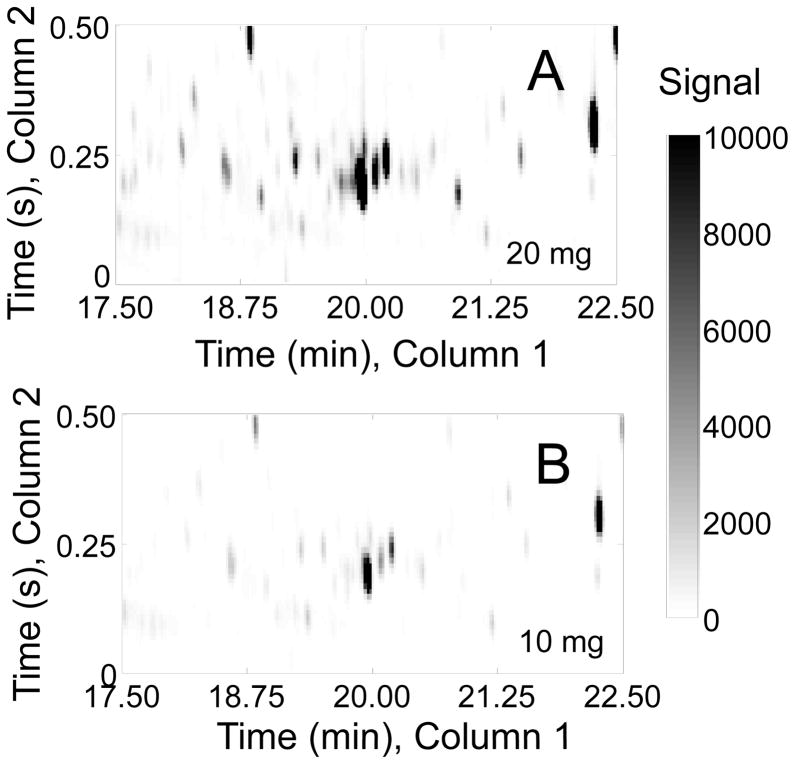
The investigation of naturally volatile and derivatized metabolites in mammalian tissues by comprehensive two-dimensional (2D) gas chromatography coupled with time-of-flight mass spectrometry (GC × GC-TOFMS) can provide the data for a comprehensive analysis of the pathophysiology of disease processes. When relative quantification is needed for hypothesis testing, the preparation of sample tissue must provide clear evidence that a quantitative relationship exists between the final detected signal and the amount of metabolite in the tissue. Herein, we report the optimization of a metabolite extraction method for mouse heart tissue for GC × GC-TOFMS analysis. A recursive extraction experiment was initially performed to measure the extraction efficiency of representative target metabolites (sugars, tricarboxylic acid cycle metabolites, amino acids, lipid and signaling molecules) in the aqueous fraction of a three-phase extraction system involving tissue, methanol:water, and chloroform. Some metabolites suffered from incomplete extraction with a single extraction of ≈ 40 mg in 600 μl organic and 400 μl aqueous phases, possibly caused by saturation effects. Subsequent experiments, calibrating resulting metabolite signal to the mass of heart tissue extracted, demonstrated that doubling the solvent volumes and a lower tissue mass was needed to provide accurate relative quantification of the derivatized mouse heart metabolome. We demonstrate quantitative extraction of metabolites from ≈ 20 mg of heart tissue using 1200 μl organic phase (chloroform) and 800 μl aqueous phase (methanol:water in equal parts by volume).


Figures

Figure 1
Figure 1
Recursive extraction experiment procedure to evaluate the effectiveness of extracting ~ 40 mg of heart tissue in 600 μl chloroform and 400 μl methanol:water (1:1 by volume).
Figure 2
Figure 2
The tissue mass calibration experiment schematic is shown detailing the procedure used to evaluate the linearity of response of the metabolite signal relative to mass of heart extracted for targeted metabolites. Four nominal masses of heart tissue were taken from three different mice: ~ 40 mg, ~ 20 mg, ~ 10 mg, and ~ 5 mg.
Figure 3
Figure 3
A representative GC × GC – TOFMS chromatogram at m/z 73 from a single heart tissue sample is presented, showing all trimethylsilated metabolites from the derivatization of the aqueous layer of the extraction of 20 mg of mouse heart tissue.
Figure 4
Figure 4
Representative quantitative results of the recursive extraction experiment (using procedure outlined in Fig. 1) of ~ 40 mg of heart tissue are shown. Replicate injections of each recursive extraction are shown. Signal for each metabolite was determined using PARAFAC signal deconvolution software [,21]. The actual PARAFAC signals have been scaled down by a factor of 100,000 for clarity.
Figure 4
Figure 4
Representative quantitative results of the recursive extraction experiment (using procedure outlined in Fig. 1) of ~ 40 mg of heart tissue are shown. Replicate injections of each recursive extraction are shown. Signal for each metabolite was determined using PARAFAC signal deconvolution software [,21]. The actual PARAFAC signals have been scaled down by a factor of 100,000 for clarity.
Figure 5
Figure 5
Quantitative results for the eight representative metabolites following the tissue mass calibration experiment (using procedure outlined in Fig. 2) based upon extracting four different masses of heart tissue from three different hearts is shown. Different hearts are shown as different symbols. Duplicate injections of each piece of heart were analyzed. Signal for each metabolite was determined using PARAFAC software [, 21]. The linear relationship between the mass of heart extracted and the signal detected for each metabolite is provided. The PARAFAC signals have been scaled down by 100,000 for clarity. The biological variation across six injections (three mice) is indicated as the RSD for each grouping of heart tissue masses (masses varied less than 4% RSD for each group). Linear regression is shown with Pearson’s correlation coefficient, with results indicating good linearity. The high residuals and low correlation coefficient observed is dominated by the biological variation. Linearity was also observed for many other metabolites (not shown for brevity).
Figure 5
Figure 5
Quantitative results for the eight representative metabolites following the tissue mass calibration experiment (using procedure outlined in Fig. 2) based upon extracting four different masses of heart tissue from three different hearts is shown. Different hearts are shown as different symbols. Duplicate injections of each piece of heart were analyzed. Signal for each metabolite was determined using PARAFAC software [, 21]. The linear relationship between the mass of heart extracted and the signal detected for each metabolite is provided. The PARAFAC signals have been scaled down by 100,000 for clarity. The biological variation across six injections (three mice) is indicated as the RSD for each grouping of heart tissue masses (masses varied less than 4% RSD for each group). Linear regression is shown with Pearson’s correlation coefficient, with results indicating good linearity. The high residuals and low correlation coefficient observed is dominated by the biological variation. Linearity was also observed for many other metabolites (not shown for brevity).
Figure 6
Figure 6
A zoomed in section of two GC × GC chromatograms from the mass calibration experiment is shown, plotting m/z 73 showing all trimethylsilated metabolites from the derivatization of the aqueous layer of two pieces of heart tissue from the same mouse. The two GC × GC chromatograms are from (A) 20 mg of heart tissue and (B) 10 mg of heart tissue from the same mouse extracted in 1200 μl chloroform and 800 μl methanol:water (1:1 by volume). Some important metabolite signals are not readily visible if only 10 mg is used.

Similar articles

Cited by

References

    1. Snyder LR, Hoggard JC, Montine TJ, Synovec RE. J Chromatogr A. 2010;1217:4639–4647. - PMC - PubMed
    1. Snyder LR, Cruz-Aguado R, Sadilek M, Galasko D, Shaw CA, Montine TJ. Toxicol Appl Pharmacol. 2009;240:180–188. - PMC - PubMed
    1. Rocha SM, Caldeira M, Carrola J, Santos M, Cruz N, Duarte IF. J Chromatogr A. 2012;1252:155–163. - PubMed
    1. Beckstrom A, Humston E, Snyder L, Synovec R, Juul S. J Chromatogr A. 2011;1218:1899–1906. - PMC - PubMed
    1. Beckstrom AC, Tanya P, Humston EM, Snyder LR, Synovec RE, Juul SE. Pediatr Res. 2012;71:338–344. - PMC - PubMed

Publication types

LinkOut - more resources