

Myelin antigen load influences antigen presentation and severity of central nervous system autoimmunity
- PMID: 23601904
- PMCID: PMC3653999
- DOI: 10.1016/j.jneuroim.2013.03.012
Myelin antigen load influences antigen presentation and severity of central nervous system autoimmunity
Abstract
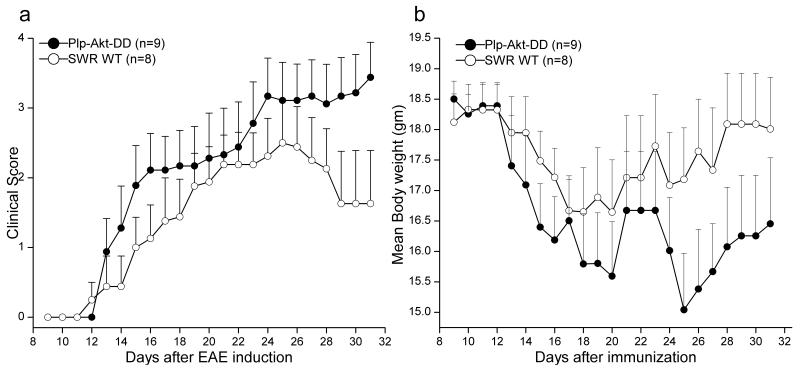
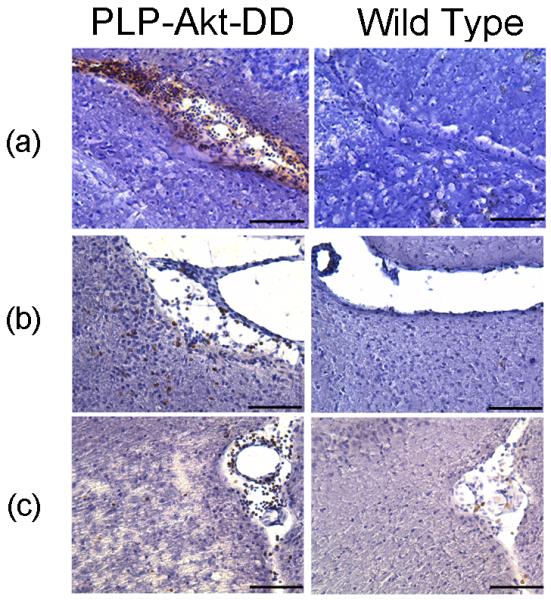
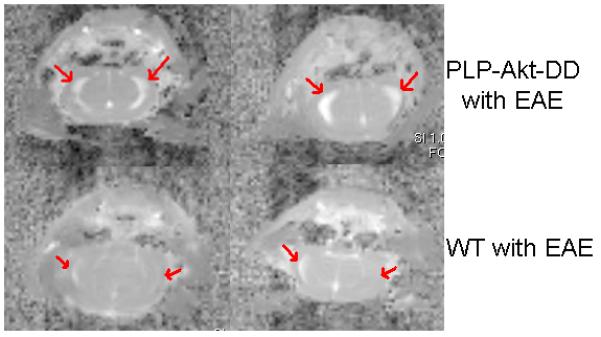
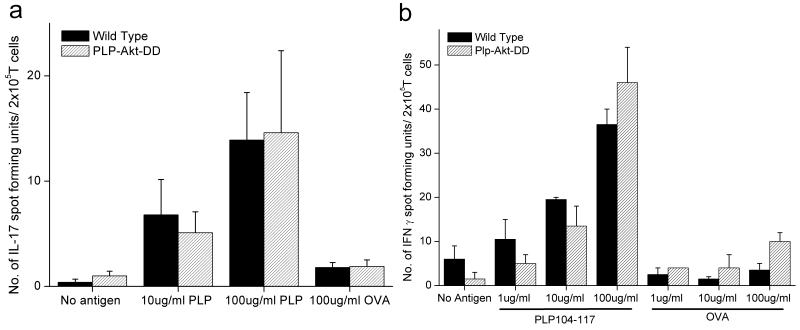
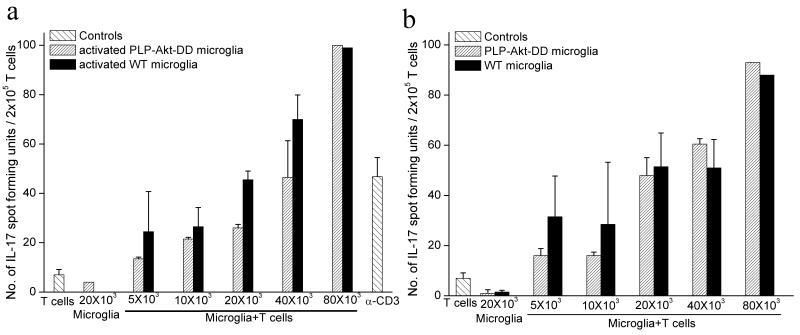
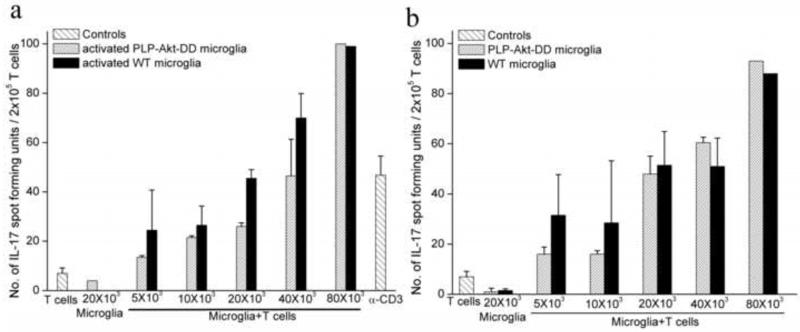
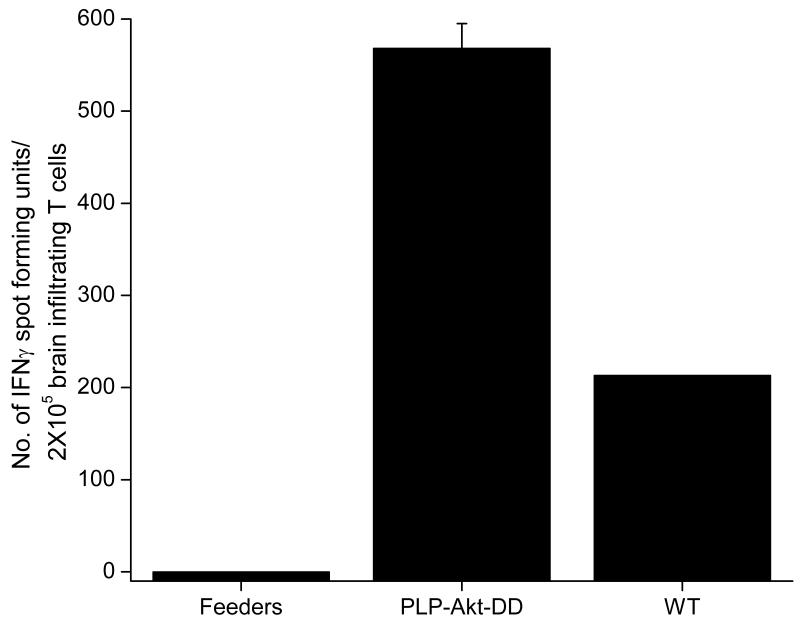
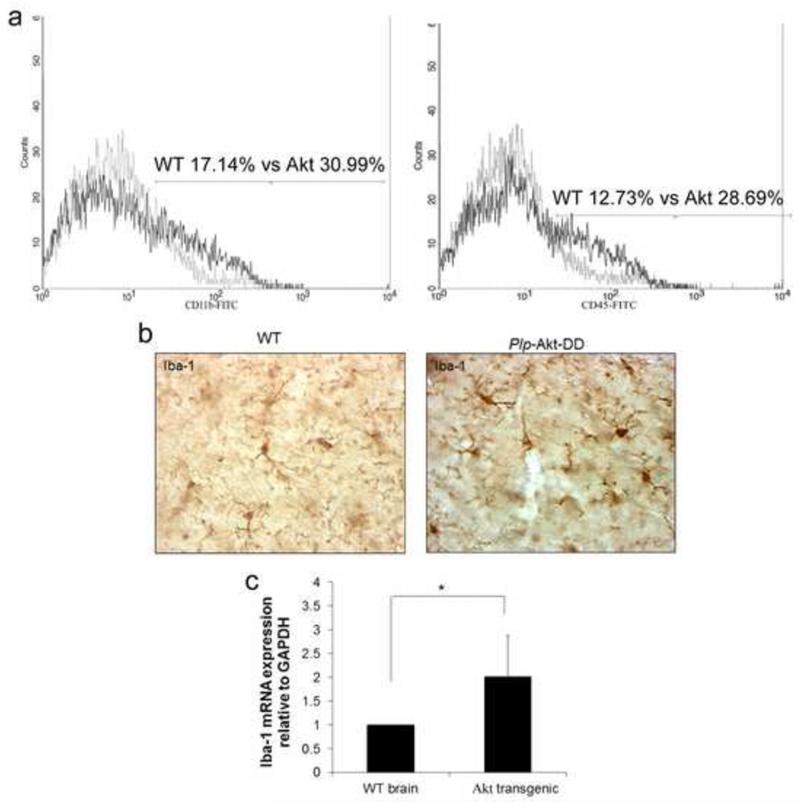
This study was designed to understand the impact of self-antigen load on manifestation of organ specific autoimmunity. Using a transgenic mouse model characterized by CNS hypermyelination, we show that larger myelin content results in greater severity of experimental autoimmune encephalomyelitis attributable to an increased number of microglia within the hypermyelinated brain. We conclude that a larger self-antigen load affects an increase in number of tissue resident antigen presenting cells (APCs) most likely due to compensatory antigen clearance mechanisms thereby enhancing the probability of productive T cell-APC interactions in an antigen abundant environment and results in enhanced severity of autoimmune disease.
Copyright © 2013 Elsevier B.V. All rights reserved.
Figures
Similar articles
-
Endogenous presentation of self myelin epitopes by CNS-resident APCs in Theiler's virus-infected mice.J Clin Invest. 1999 Sep;104(5):599-610. doi: 10.1172/JCI7292. J Clin Invest. 1999. PMID: 10487774 Free PMC article.
-
Neutrophils amplify autoimmune central nervous system infiltrates by maturing local APCs.J Immunol. 2013 Nov 1;191(9):4531-9. doi: 10.4049/jimmunol.1202613. Epub 2013 Sep 23. J Immunol. 2013. PMID: 24062488
-
Myelin-specific T cells also recognize neuronal autoantigen in a transgenic mouse model of multiple sclerosis.Nat Med. 2009 Jun;15(6):626-32. doi: 10.1038/nm.1975. Nat Med. 2009. PMID: 19483694
-
Contribution of CD8 T lymphocytes to the immuno-pathogenesis of multiple sclerosis and its animal models.Biochim Biophys Acta. 2011 Feb;1812(2):151-61. doi: 10.1016/j.bbadis.2010.07.006. Epub 2010 Jul 15. Biochim Biophys Acta. 2011. PMID: 20637863 Free PMC article. Review.
-
Differential roles of resident microglia and infiltrating monocytes in murine CNS autoimmunity.Semin Immunopathol. 2015 Nov;37(6):613-23. doi: 10.1007/s00281-015-0519-z. Epub 2015 Aug 4. Semin Immunopathol. 2015. PMID: 26240063 Review.
Cited by
-
Immunotherapeutic target expression on breast tumors can be amplified by hormone receptor antagonism: a novel strategy for enhancing efficacy of targeted immunotherapy.Oncotarget. 2017 May 16;8(20):32536-32549. doi: 10.18632/oncotarget.15812. Oncotarget. 2017. PMID: 28430646 Free PMC article.
-
Phenotypic characterization of a Csf1r haploinsufficient mouse model of adult-onset leukodystrophy with axonal spheroids and pigmented glia (ALSP).Neurobiol Dis. 2015 Feb;74:219-28. doi: 10.1016/j.nbd.2014.12.001. Epub 2014 Dec 9. Neurobiol Dis. 2015. PMID: 25497733 Free PMC article.
-
Retinal antigen-specific regulatory T cells protect against spontaneous and induced autoimmunity and require local dendritic cells.J Neuroinflammation. 2014 Dec 11;11:205. doi: 10.1186/s12974-014-0205-4. J Neuroinflammation. 2014. PMID: 25498509 Free PMC article.
-
Cnp Promoter-Driven Sustained ERK1/2 Activation Increases B-Cell Activation and Suppresses Experimental Autoimmune Encephalomyelitis.ASN Neuro. 2020 Jan-Dec;12:1759091420971916. doi: 10.1177/1759091420971916. ASN Neuro. 2020. PMID: 33228381 Free PMC article.
-
Fasudil regulates T cell responses through polarization of BV-2 cells in mice experimental autoimmune encephalomyelitis.Acta Pharmacol Sin. 2014 Nov;35(11):1428-38. doi: 10.1038/aps.2014.68. Epub 2014 Sep 29. Acta Pharmacol Sin. 2014. PMID: 25263338 Free PMC article.
References
-
- Batchelor PE, Tan S, Wills TE, Porritt MJ, Howells DW. Comparison of inflammation in the brain and spinal cord following mechanical injury. J Neurotrauma. 2008;25:1217–1225. - PubMed
-
- Bodine SC, Stitt TN, Gonzalez M, Kline WO, Stover GL, Bauerlein R, Zlotchenko E, Scrimgeour A, Lawrence JC, Glass DJ, Yancopoulos GD. Akt/mTOR pathway is a crucial regulator of skeletal muscle hypertrophy and can prevent muscle atrophy in vivo. Nat. Cell Biol. 2001;3:1014–1019. - PubMed
-
- Cassiani-Ingoni R, Muraro PA, Magnus T, Reichert-Scrivner S, Schmidt J, Huh J, Quandt JA, Bratincsak A, Shahar T, Eusebi F, Sherman LS, Mattson MP, Martin R, Rao MS. Disease progression after bone marrow transplantation in a model of multiple sclerosis is associated with chronic microglial and glial progenitor response. J. Neuropathol. Exp. Neurol. 2007;66:637–649. - PubMed
-
- Condorelli G, Drusco A, Stassi G, Bellacosa A, Roncarati R, Iaccarino G, Russo MA, Gu Y, Dalton N, Chung C, Latronico MV, Napoli C, Sadoshima J, Croce CM, Ross J., Jr. Akt induces enhanced myocardial contractility and cell size in vivo in transgenic mice. Proc. Natl. Acad. Sci. USA. 2002;99:12333–12338. - PMC - PubMed
-
- De Haas AH, Boddeke HWGM, Biber K. Region-Specific Expression of Immunoregulatory Proteins on Microglia in the Healthy CNS. Glia. 2008;58:888–894. - PubMed
Publication types
MeSH terms
Substances
Grants and funding
LinkOut - more resources
Full Text Sources
Other Literature Sources
Miscellaneous
