

Subscale validation of the neuropsychiatric inventory questionnaire: comparison of Alzheimer's disease neuroimaging initiative and national Alzheimer's coordinating center cohorts
- PMID: 23602309
- PMCID: PMC3913908
- DOI: 10.1016/j.jagp.2012.10.027
Subscale validation of the neuropsychiatric inventory questionnaire: comparison of Alzheimer's disease neuroimaging initiative and national Alzheimer's coordinating center cohorts
Abstract
Objective: Neuropsychiatric symptoms are prevalent in mild cognitive impairment (MCI) and Alzheimer disease (AD) and commonly measured using the Neuropsychiatric Inventory (NPI). Based on existing exploratory literature, we report preliminary validation of three NPI Questionnaire (NPI-Q-10) subscales that measure clinically meaningful symptom clusters.
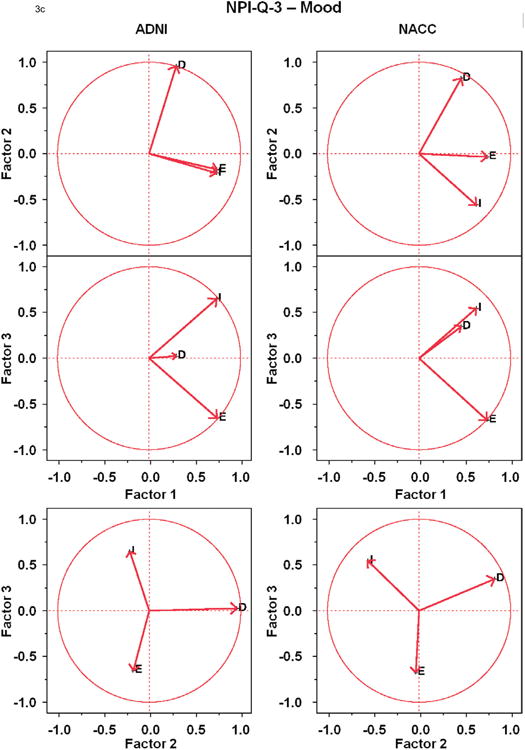
Methods: Cross-sectional results for three subscales (NPI-Q-4-Frontal, NPI-Q-4-Agitation/Aggression, NPI-Q-3-Mood) in amnestic MCI and AD dementia cases from the National Alzheimer's Coordinating Center (NACC) and Alzheimer's Disease Neuroimaging Initiative (ADNI) databases were analyzed using confirmatory unrotated principal component analysis.
Results: ADNI contributed 103 MCI, 90 MCI converters, and 112 AD dementia cases, whereas NACC contributed 1,042 MCI, 763 MCI converters, and 3,048 AD dementia cases. NACC had higher baseline mean age (75.7 versus 74.6), and more impaired mean scores (at month 24) on Mini-Mental State Exam (19.5 versus 22.4) and NPI-Q-10 (5.0 versus 4.3), and all NPI-Q subscales than ADNI. Medians were not different between cohorts for NPI-Q-4-Agitation/Aggression, and NPI-Q-3-Mood, however. Each item on all scales/subscales contributed variance in principal component analysis Pareto plots. All items in Factor (F) 1 for each scale/subscale projected in a positive direction on biplots (revealing coherence), whereas F2 and F3 items showed more spatial separation (revealing independence). There were remarkable similarities between cohorts for factor loadings and spatial patterns of item projections, although factor item identities varied somewhat, especially beyond F1.
Conclusion: The similar pattern of results across two cohorts support validity of these subscales, which are worthy of further psychometric evaluation in MCI and AD patients and preliminary application in clinical settings.
Copyright © 2013. Published by Elsevier Inc.
Conflict of interest statement
Dr. Saykin receives support from the NIH National Institute on Aging (R01 AG19771 as PI; P30 AG10133 Indiana ADC as Imaging Core leader; U01 AG024904 and RC2 AG036535 as ADNI Genetics Core leader; and U01 AG032984 Alzheimer's Disease Genetics Consortium as site PI).
Dr. Cummings has provided consultation to Abbott, Acadia, Acerra, ADAMAS, Anavex, Astellas, Avanir, Baxter, Bristol-Myers Squibb, Eisai, Elan, EnVivo, Forest, Genentech, GlaxoSmithKline, Janssen, Lilly, Lundbeck, Medivation, Medtronics, Merck, Neurokos, Novartis, Pfizer, Prana, QR, Sonexa, Takeda, and Toyama pharmaceutical companies and Bayer, Avid, GE, MedAvante, Neurotrax, and UBC Assessment Companies. Dr. Cummings owns stock in ADAMAS, Prana, Sonexa, MedAvante, Neurotrax, Neurokos, and QR pharma and owns the copyright of the Neuropsychiatric Inventory scale. He is a speaker/lecturer for Eisai, Forest, Janssen, Novartis, Pfizer, Lundbeck.
Figures


Similar articles
-
Examining differences in neuropsychiatric symptom factor trajectories in empirically derived mild cognitive impairment subtypes.Int J Geriatr Psychiatry. 2018 Dec;33(12):1627-1634. doi: 10.1002/gps.4963. Epub 2018 Oct 1. Int J Geriatr Psychiatry. 2018. PMID: 30276884 Free PMC article.
-
Neuropsychiatric symptoms and brain morphology in patients with mild cognitive impairment and Alzheimer's disease with dementia.Int Psychogeriatr. 2021 Nov;33(11):1217-1228. doi: 10.1017/S1041610221000934. Epub 2021 Aug 17. Int Psychogeriatr. 2021. PMID: 34399870
-
Network analysis of neuropsychiatric symptoms in Alzheimer's disease.Alzheimers Res Ther. 2023 Aug 11;15(1):135. doi: 10.1186/s13195-023-01279-6. Alzheimers Res Ther. 2023. PMID: 37568209 Free PMC article.
-
Does the neuropsychiatric inventory predict progression from mild cognitive impairment to dementia? A systematic review and meta-analysis.Ageing Res Rev. 2020 Mar;58:101004. doi: 10.1016/j.arr.2019.101004. Epub 2019 Dec 24. Ageing Res Rev. 2020. PMID: 31881368
-
Psychometric Properties of the Neuropsychiatric Inventory: A Review.J Alzheimers Dis. 2022;86(4):1485-1499. doi: 10.3233/JAD-200739. J Alzheimers Dis. 2022. PMID: 32925068 Free PMC article. Review.
Cited by
-
Agitation and impulsivity in mid and late life as possible risk markers for incident dementia.Alzheimers Dement (N Y). 2020 Sep 6;6(1):e12016. doi: 10.1002/trc2.12016. eCollection 2020. Alzheimers Dement (N Y). 2020. PMID: 32995467 Free PMC article. Review.
-
An Initial Empirical Operationalization of the Earliest Stages of the Alzheimer's Continuum.Alzheimer Dis Assoc Disord. 2021 Jan-Mar 01;35(1):62-67. doi: 10.1097/WAD.0000000000000408. Alzheimer Dis Assoc Disord. 2021. PMID: 33009036 Free PMC article.
-
Antipsychotic Use in a Diverse Population With Dementia: A Retrospective Review of the National Alzheimer's Coordinating Center Database.J Neuropsychiatry Clin Neurosci. 2015 Fall;27(4):326-32. doi: 10.1176/appi.neuropsych.15010020. J Neuropsychiatry Clin Neurosci. 2015. PMID: 26488486 Free PMC article.
-
Statistical harmonization of everyday functioning and dementia-related behavioral measures across nine surveys and trials.Alzheimers Dement (Amst). 2023 Mar 15;15(1):e12412. doi: 10.1002/dad2.12412. eCollection 2023 Jan-Mar. Alzheimers Dement (Amst). 2023. PMID: 36935763 Free PMC article.
-
Latent Classes of Neuropsychiatric Symptoms in NACC Controls and Conversion to Mild Cognitive Impairment or Dementia.J Alzheimers Dis. 2015;48(2):483-93. doi: 10.3233/JAD-150421. J Alzheimers Dis. 2015. PMID: 26402012 Free PMC article.
References
-
- Geda YE, Roberts RO, Knopman DS, et al. Baseline neuropsychiatric symptoms and the risk of incident Mild Cognitive Impairment: the Mayo Clinic Study of Aging. Presentation at the annual meeting of American Academy of Neurology. 2011
-
- Gaugler JE, Wall MM, Kane RL, et al. The effects of incident and persistent behavioral problems on change in caregiver burden and nursing home admission of persons with dementia. Med Care. 2010;48:875–883. - PubMed
-
- Gaugler JE, Wall MM, Kane RL, et al. Does caregiver burden mediate the effects of behavioral disturbances on nursing home admission? Am J Geriatr Psychiatry. 2011;19(6):497–506. - PubMed
Publication types
MeSH terms
Grants and funding
LinkOut - more resources
Full Text Sources
Other Literature Sources
Medical
Miscellaneous
