. 2013 May 7;21(5):820-32.
doi: 10.1016/j.str.2013.03.008. Epub 2013 Apr 18.

Structures of CD200/CD200 receptor family and implications for topology, regulation, and evolution

Affiliations

Structures of CD200/CD200 receptor family and implications for topology, regulation, and evolution

Deborah Hatherley et al. Structure. .

Abstract

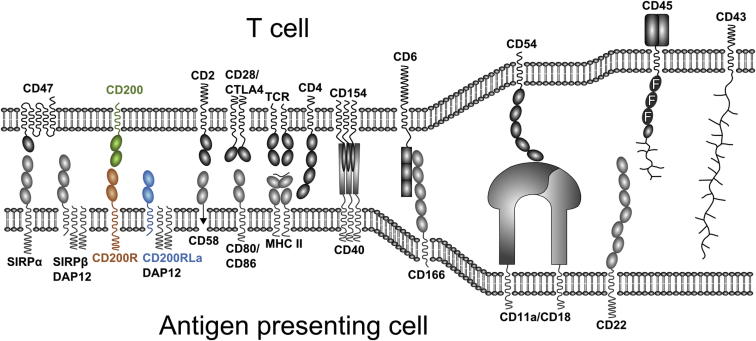
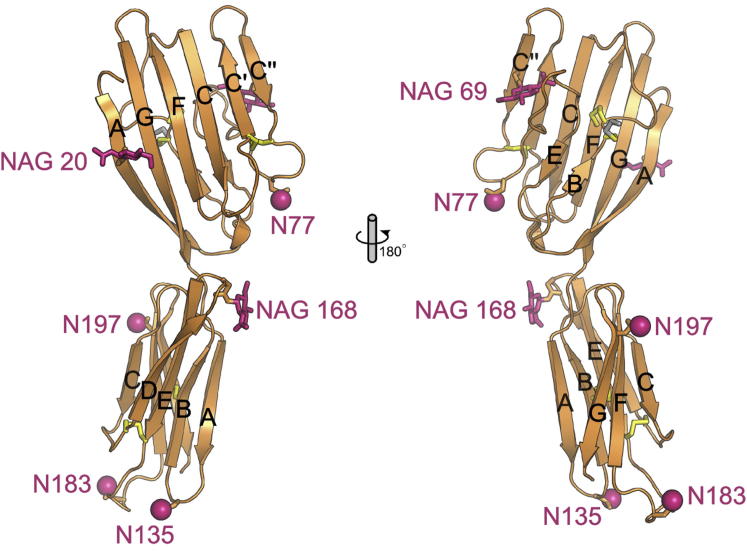
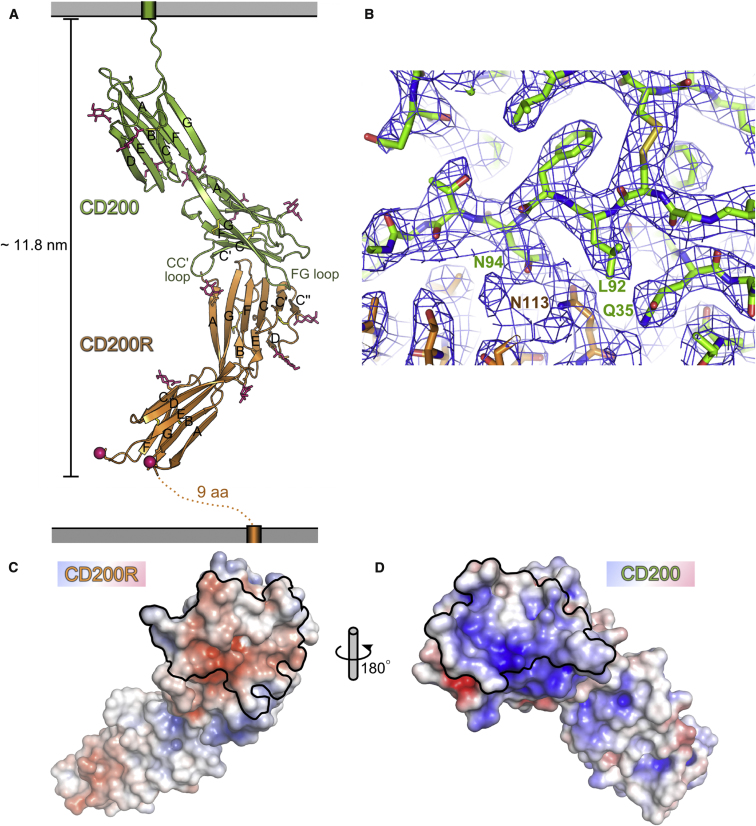
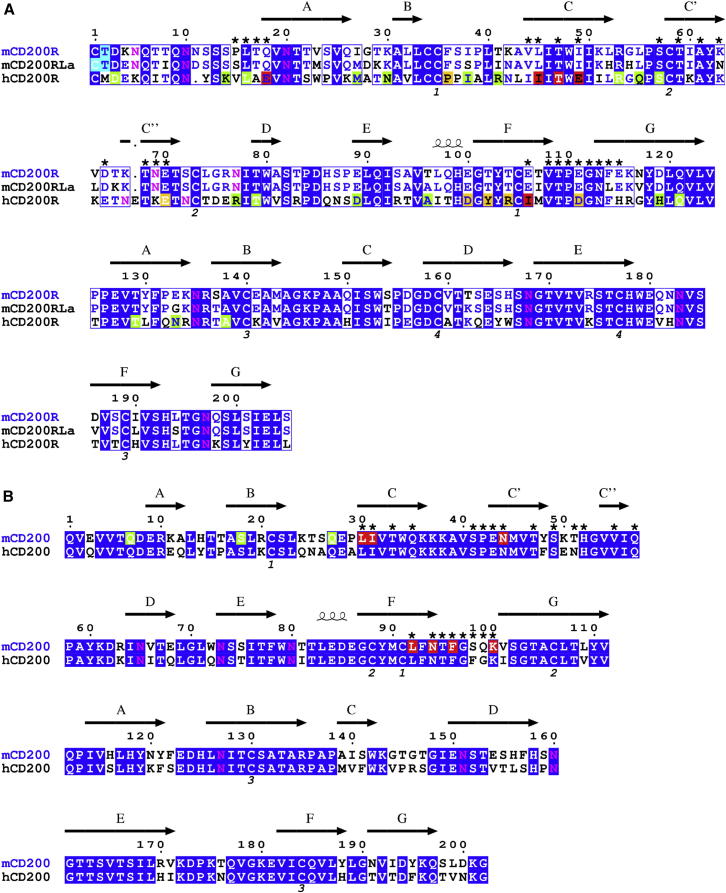
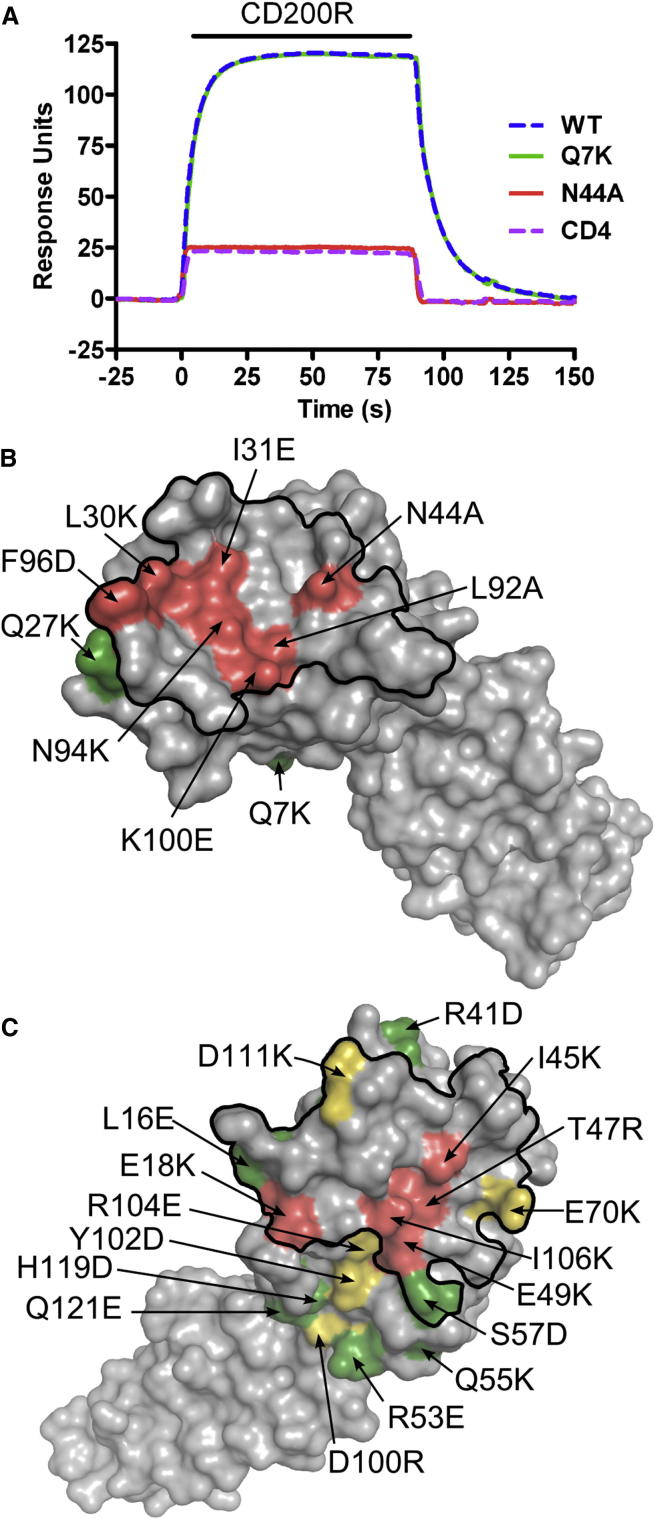
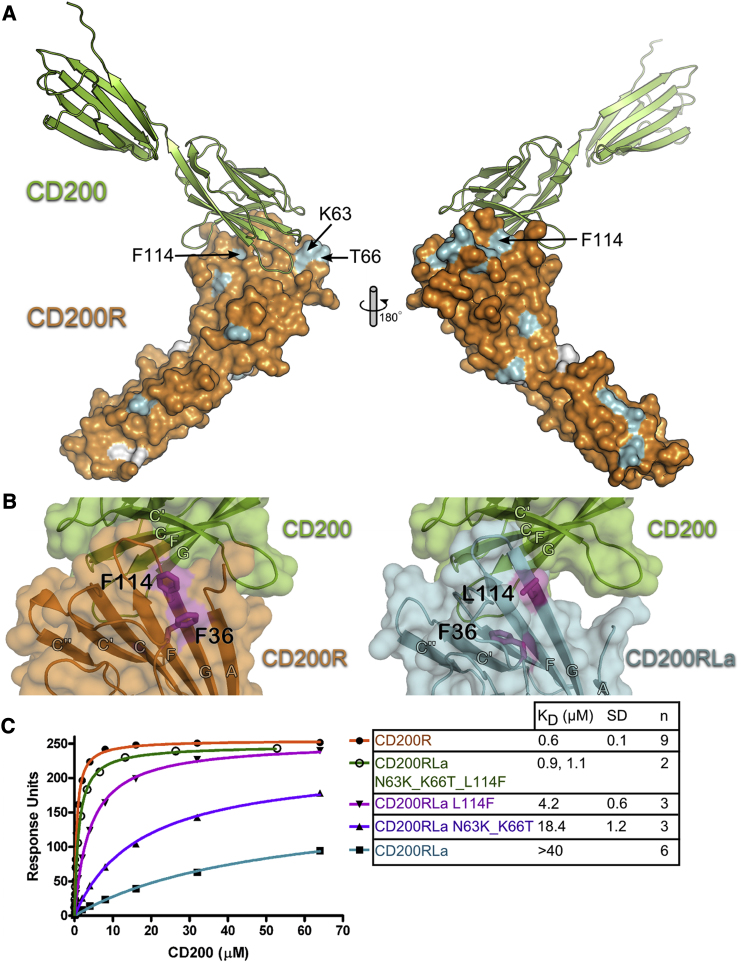
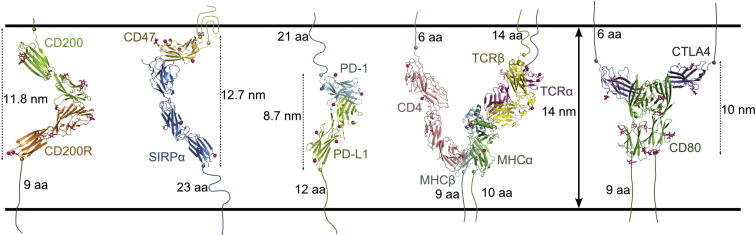
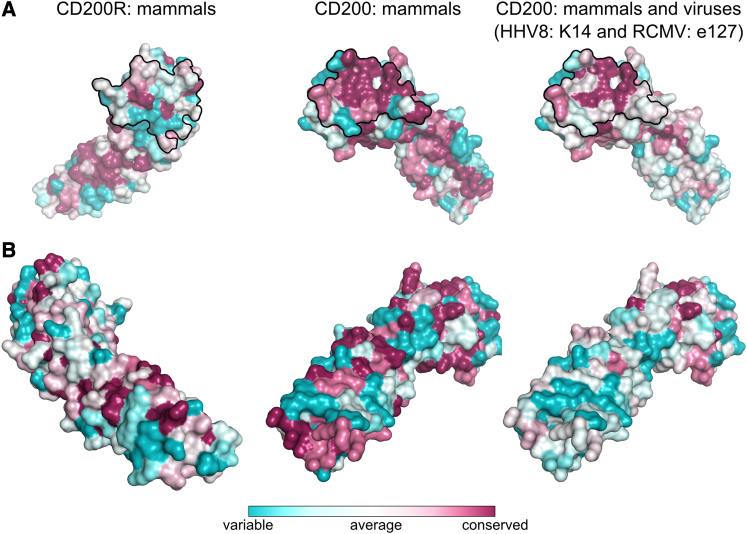
CD200 is a widely distributed membrane glycoprotein that regulates myeloid cell activity through its interaction with an inhibitory receptor (CD200R). The interaction is of interest as a target for treating excessive inflammation and for treating leukemia. There are closely related proteins to CD200R that give activating signals making this a "paired receptor." We report X-ray crystallography structures for the inhibitory CD200R, the activating receptor CD200RLa, and a complex between CD200R and CD200. Both CD200 and CD200R contain two Ig-like domains and interact through their NH₂ terminal domains compatible with immunological synapse-like interactions occurring between myeloid cells and other CD200-expressing cells. The failure of the activating receptor to bind CD200 resides in subtle changes around the interface. CD200 has been acquired by herpes viruses to mimic the host interaction. CD200R has evolved rapidly presumably driven by pathogen pressure but it may also be important in homeostasis through interactions with commensal bacteria.


Figures

Figure 1
Figure 1
Schematic Illustrating Interactions between an Antigen-Presenting Cell and T Cell Immunogloblin domains are shown as ovals. Fibronectin domains are shown as ovals with the letter F inside. Scavenger receptor cysteine-rich domains are shown as rectangles. Tumor necrosis factor receptor (TNFR) and TNF domains are represented by long thin rectangles and long thin ovals, respectively. The mucin-like structure of CD43 and the N-terminal glycosylated region of CD45 are shown as lines.
Figure 2
Figure 2
Structural Characteristics of Mouse CD200R. The mouse CD200R structure is shown as an orange cartoon. Beta strands of each Ig-like domain are labeled A-G. Observed N-acetylglucosamine (NAG) moieties (N20, N69 and N168) are shown as pink sticks and other potential N-linked glycosylation sites are represented by pink spheres N77, N135, N183 and N197. Disulfide bonds are shown as yellow sticks. Cys 34 is shown forming a disulfide bond with a free Cys (gray stick). CD200R is rotated 180° in right hand panel. See also Figure S2.
Figure 3
Figure 3
Structure of the CD200/CD200R Complex (A) The complex is shown with CD200 in green and CD200R in orange. Beta strands of each Ig-like domain are labeled A–G. Observed NAG moieties are shown as pink sticks and potential N-linked glycosylation sites are represented by pink spheres. Disulfide bonds are represented as yellow sticks. (B) Representative electron density showing CD200 (green carbon atoms) and CD200R (orange carbon atoms) at the interaction interface. The final refined model is shown in 2Fo-Fc electron density (1 σ) calculated at the end of refinement. (C and D) Open book representation of the CD200 / CD200R interface. The surface of CD200R as viewed by CD200 (C). The molecular surface of CD200R is shown colored by electrostatic potential with the residues at the interaction interface bordered by a black line. The surface of CD200 as viewed by CD200R (D). The molecular surface of CD200 is shown, colored by electrostatic potential with the residues at the interaction interface bordered by a black line. See also Figure S3.
Figure 4
Figure 4
Sequence Alignment of the Extracellular Regions of the CD200R Family and CD200 The sequences for mouse CD200R (NP_067300), mouse CD200RLa (NP_997127) and human CD200R (NP_740750) are shown in (A) and the sequences for mouse and human CD200 (accession numbers NP_034948 and EAW79672 respectively) are shown in (B). Amino acid secondary structure is based on the mouse CD200R and CD200 structures. Residues identical between the sequences are highlighted in blue. NH2-terminal residues determined by protein sequencing are highlighted in cyan; CD200RLa consisted of a mixture of two different NH2 termini differing by one amino acid starting with either Cys or Thr. The NH2 termini of recombinant human and mouse CD200 was not detected presumably due to the presence of cyclized glutamine (pyroglutamic acid) as predicted from peptide analysis of rat CD200 (Clark et al., 1985). Potential N-linked glycosylation sites are shown in pink. Cys residues forming disulfide bonds are numbered below the alignment. Residues at the CD200/CD200R interface are denoted by asterisks. Cys residues forming disulfide bonds are numbered below the alignment. Residues at the mouse CD200/CD200R interface are denoted by asterisks. Single point mutations of human CD200R (Hatherley and Barclay, 2004) and mouse CD200 are highlighted according to their ability to bind human CD200 and mouse CD200R respectively; red denotes mutation results in < 25% wild-type binding, yellow 25%–75%, and green > 75% binding.
Figure 5
Figure 5
Single Point Mutations in CD200 at the CD200/CD200R Interface Prevent CD200R Binding (A) Surface plasmon resonance experiment shows immobilized CD200 mutant Q7K (green line) binds soluble CD200R similarly to wild-type (WT) CD200 (blue line), whereas CD200 mutant N44A (red line) and the negative control CD4 (pink dashed line) do not bind CD200R. Injection of soluble CD200R over the immobilized proteins is represented by the solid black bar. (B) Single point mutation of CD200 at the crystallographic CD200/CD200R interface prevents the interaction. The molecular surface of CD200 is shown in the same orientation as in Figure 3D. Single point mutations of mouse CD200 are colored according to their ability to bind mouse CD200R. Residues colored red denote mutation results in < 25% wild-type binding and green > 75% binding. (C) Mapping of single point mutations of human CD200R (Hatherley and Barclay, 2004) onto the mouse CD200R structure delineates the CD200 binding site to the AGFCC′C″ face. Residues colored red denotes mutation resulting in < 25% wild-type binding, yellow 25%–75% and green > 75% binding. (B) and (C) are in the same orientation as Figures 3D and 3C, respectively. See also Table S1.
Figure 6
Figure 6
The Inability of CD200RLa to Bind CD200 (A) The structure of CD200 (green cartoon) in complex with CD200R (orange surface) is shown. Residues differing between CD200La and CD200R are colored cyan. Additional residues of CD200RLa that differ from the CD200R sequence crystallized but that are found in other CD200R variants (from Ensembl database, http://www.ensembl.org) are colored white. Three residues of CD200R that differ from CD200RLa that are at or peripheral to the CD200/CD200R interface are labeled. (B) Left panel: transparent surface and cartoon representation of the CD200 (green) in complex with CD200R (orange); F36 and F114 are shown as sticks and colored purple. Right panel: virtual complex between CD200RLa (cyan) and CD200 (green); F36 and L114 are colored purple and the loss of the N-terminal strand from the interface is highlighted. (C) Surface plasmon resonance experiments show that mutation of three CD200RLa residues (N63, K66 and L114F) is required to gain CD200 binding (∼60% of wild-type). Recombinant CD200R, wild-type CD200RLa, and mutant CD200RLa were immobilized on a BIAcore chip and increasing concentrations of CD200 were injected over the proteins. A representative experiment is shown. KDs were calculated by nonlinear curve fitting. The number (n) of times the experiment was repeated and the standard deviation (SD) of the KDs calculated are given. For differences between the receptors, see alignment in Figure S4.
Figure 7
Figure 7
Topology of the CD200/CD200R Interaction at the Cell Surface The dimensions of the CD200/CD200R interaction are compared to other interactions thought to occur in immunologic synapses. A model of the CD47/SIRPα interaction was generated by superimposing the crystal structure of the full extracellular domain of SIRPα (Protein Data Bank ID [PDB] code 2wng) onto the crystal structure of the V-like domain of SIRPα in complex with CD47 (PDB code 2jjs). Cartoons for the crystal structures of PD-1/PD-L1 (PBD code 3bik), CD4/TCR/MHC (PDB code 3t0e), and CTLA-4/CD80 (PDB code 1i8l) are shown. The approximate dimensions of the interacting protein complexes are shown. The last observed COOH-terminal residue in each structure is represented as a sphere. The number of amino acid (aa) residues that link the protein structures to their predicted transmembrane regions are given. Observed NAG and mannose moieties are shown as pink sticks and the sites of potential N-linked glycosylation sites are shown as pink spheres.
Figure 8
Figure 8
The CD200/CD200R Binding Site Is Conserved in Mammals and Some Viruses The ConSurf Server (Ashkenazy et al., 2010) was used to estimate the evolutionary conservation of amino acids in CD200 and CD200R using a multiple sequence alignment of mammalian (and two viral) CD200 and CD200R orthologs (generated by Clustal W2 (Larkin et al., 2007) and the CD200/CD200R coordinates. (A) Left panel: conservation of CD200R amino acids in the following mammals: mouse (NP_067300.1), human (NP_620161.1), chimp (XP_001156654.1), monkey (XP_001105494.1), wolf (XP_545099.2), cow (XP_002684796.2), and rat (NP_076443.1). The view of CD200R is the same as that in Figure 3C. Centere panel: conservation of CD200 amino acids in the following mammals: mouse (NP_034948.3), human (NP_001004196.2), chimp (XP_516648.3), monkey (XP_001104031.1), wolf (XP_849283.2), cow (NP_001029792.1), and rat (NP_113706.1). The view of CD200 is the same as that in Figure 3D. Right panel: conservation of CD200 amino acids in mammals (as in center panel) and the viral orthologs K14 (AAK53415.1) and e127 (AAO45420.1) from the human herpes virus 8 (HHV8) and the rat cytomegalovirus (RCMV), respectively. The black line outlines the residues at the CD200/CD200R interface. The relative degrees of residue conservation are colored from blue for variable positions to dark pink for conserved residues. (B) CD200R and CD200 are rotated 180° from (A).

References

    1. Akkaya M., Barclay A.N. Heterogeneity in the CD200R paired receptor family. Immunogenetics. 2010;62:15–22. - PubMed
    1. Akkaya M., Barclay A.N. How do pathogens drive the evolution of paired receptors? Eur. J. Immunol. 2013;43:303–313. - PubMed
    1. Ashkenazy H., Erez E., Martz E., Pupko T., Ben-Tal N. ConSurf 2010: calculating evolutionary conservation in sequence and structure of proteins and nucleic acids. Nucleic Acids Res. 2010;38(Web Server issue) W529-33. - PMC - PubMed
    1. Barclay A.N. Membrane proteins with immunoglobulin-like domains—a master superfamily of interaction molecules. Semin. Immunol. 2003;15:215–223. - PubMed
    1. Barclay A.N., Ward H.A. Purification and chemical characterisation of membrane glycoproteins from rat thymocytes and brain, recognised by monoclonal antibody MRC OX 2. Eur. J. Biochem. 1982;129:447–458. - PubMed

Publication types

MeSH terms