. 2013 Aug:61:370-83.
doi: 10.1016/j.freeradbiomed.2013.04.021. Epub 2013 Apr 19.

Compartmentalized oxidative stress in dopaminergic cell death induced by pesticides and complex I inhibitors: distinct roles of superoxide anion and superoxide dismutases

Affiliations

Compartmentalized oxidative stress in dopaminergic cell death induced by pesticides and complex I inhibitors: distinct roles of superoxide anion and superoxide dismutases

Humberto Rodriguez-Rocha et al. Free Radic Biol Med. 2013 Aug.

Abstract

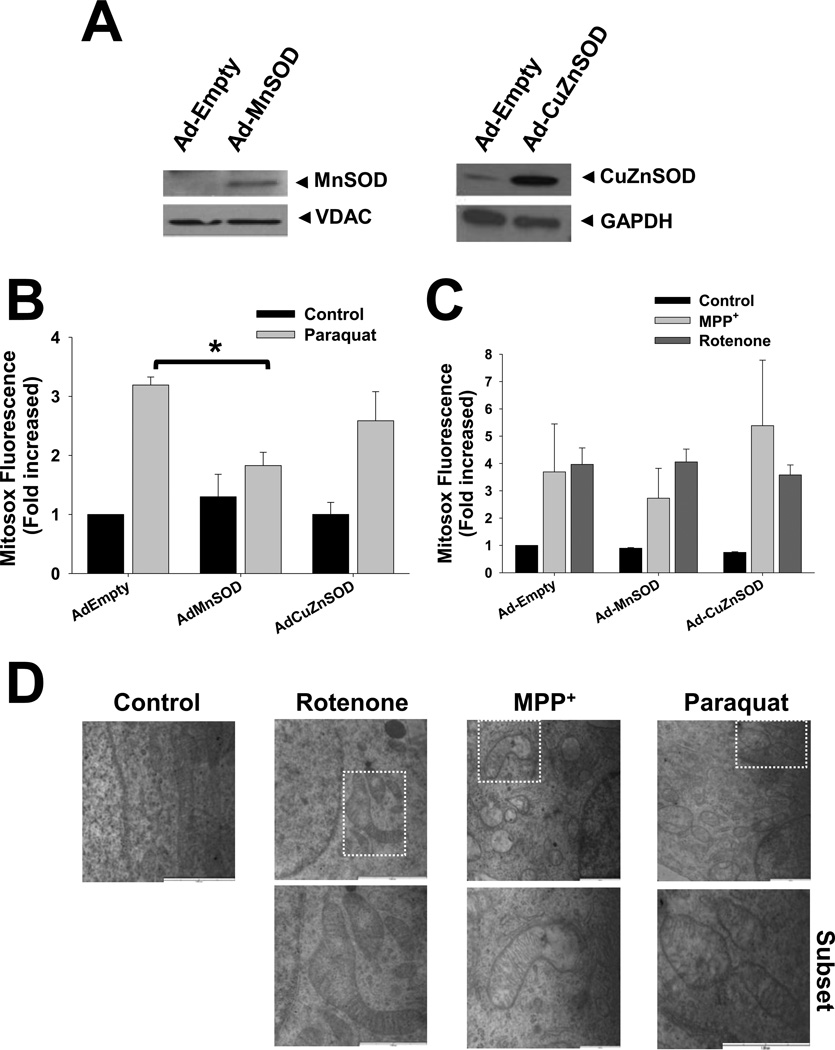
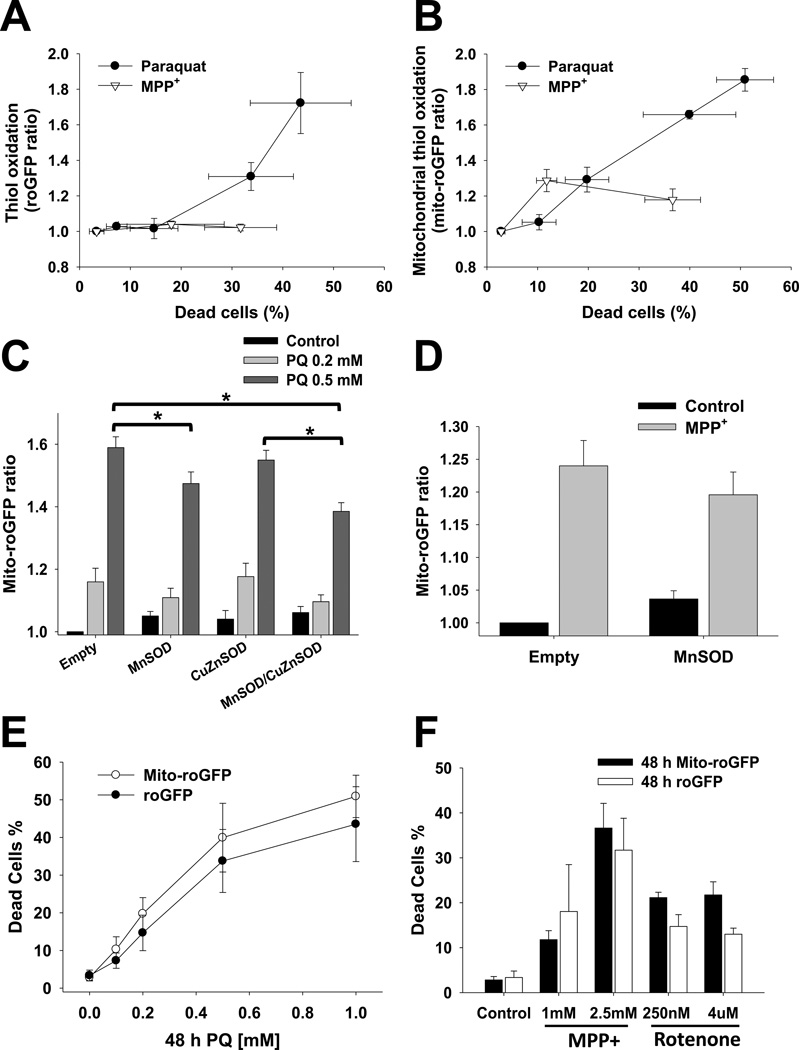
The loss of dopaminergic neurons induced by the parkinsonian toxins paraquat, rotenone, and 1-methyl-4-phenylpyridinium (MPP(+)) is associated with oxidative stress. However, controversial reports exist regarding the source/compartmentalization of reactive oxygen species (ROS) generation and its exact role in cell death. We aimed to determine in detail the role of superoxide anion (O2(•-)), oxidative stress, and their subcellular compartmentalization in dopaminergic cell death induced by parkinsonian toxins. Oxidative stress and ROS formation were determined in the cytosol, intermembrane (IMS), and mitochondrial matrix compartments, using dihydroethidine derivatives and the redox sensor roGFP, as well as electron paramagnetic resonance spectroscopy. Paraquat induced an increase in ROS and oxidative stress in both the cytosol and the mitochondrial matrix prior to cell death. MPP(+) and rotenone primarily induced an increase in ROS and oxidative stress in the mitochondrial matrix. No oxidative stress was detected at the level of the IMS. In contrast to previous studies, overexpression of manganese superoxide dismutase (MnSOD) or copper/zinc SOD (CuZnSOD) had no effect on alterations in ROS steady-state levels, lipid peroxidation, loss of mitochondrial membrane potential (ΔΨm), and dopaminergic cell death induced by MPP(+) or rotenone. In contrast, paraquat-induced oxidative stress and cell death were selectively reduced by MnSOD overexpression, but not by CuZnSOD or manganese-porphyrins. However, MnSOD also failed to prevent ΔΨm loss. Finally, paraquat, but not MPP(+) or rotenone, induced the transcriptional activation of the redox-sensitive antioxidant response elements (ARE) and nuclear factor kappa-B (NF-κB). These results demonstrate a selective role of mitochondrial O2(•-) in dopaminergic cell death induced by paraquat, and show that toxicity induced by the complex I inhibitors rotenone and MPP(+) does not depend directly on mitochondrial O2(•-) formation.

Keywords: CuZnSOD; Environmental; MPP+; MnSOD; Paraquat; Parkinson's disease; Pesticides; Porphyrins; Rotenone; SOD; roGFP.


Figures

Figure 1
Figure 1. ROS detection using dihydroethidium derivatives
In A–D, SK-N-SH cells were treated with 0.5 mM paraquat, 2.5 mM MPP+ or 4 µM rotenone for the time indicated. Then, cells were stained with Mitosox (mitochondrial O2•−) or propidium iodide (cell death), and analyzed by FACS. Histogram in A depicts the changes in the Mitosox mean fluorescence in response to paraquat. In B–D, data are expressed as O2•− production (Mitosox fluorescence) and cell survival (% of cells with low Propipdium iodide staining) normalized against control values. Experiments and plots in A–D are representative of at least three independent experiments. In E, cells were treated with 0.5 mM paraquat, 2.5 mM MPP+ or 4 µM rotenone for 48 h. Then, cells were co-stained with DHE (cytosolic ROS) or MitoSOX (mitochondrial ROS) and analyzed by FACS. Results are represented as the increase in DHE or MitoSOX mean fluorescence with respect to controls and are means ± SE of three replicas.
Figure 2
Figure 2. Mitochondrial damage and effect of SOD overexpression in ROS formation
Cells were transduced with Ad-MnSOD, Ad-CuZnSOD or Ad-Empty. In A, isolation of mitochondrial and cytosolic fractions was performed by differential centrifugation. Western blot analysis demonstrates the increased expression of SOD enzymes. VDAC and GAPDH signal was used as loading control for mitochondrial and cytosolic fractions respectively, and to evaluate cross-contamination of subcellular fraction (not shown). In B–C, cells transduced with viruses were treated with 0.5mM paraquat, 2.5 mM MPP+ or 4 µM rotenone for 48 h. Mitochondrial O2•− was determined using MitoSOX as explained in Figure 1. In D, cells were treated with parkinsonian toxins as explained above for 24 h and then, fixed with 2% glutaraldehyde. Fixed cells were processed for TEM. Blots (A), and images (D) are representative experiments and data in B and C are means ± SE of at least three independent replicas. *p<0.05 vs Ad-Empty + paraquat values.
Figure 3
Figure 3. Effect of overexpression of SODs on dopaminergic cell death induced by parkinsonian toxins
In A, cells were treated with paraquat, MPP+ or rotenone for 48 h and stained with PI. Cell death was analyzed in a forward scatter vs PI contour plot to depict cells with both a decrease in cell size (a marker for apoptosis) and loss of plasma membrane integrity. %s represent the population of cells with low PI and normal cell size (healthy cells) depicted in the lower right region. In B–D, cells were transduced with Empty, MnSOD or CuZnSOD adenoviruses 24 h prior exposure to parkinsonian toxins. Cell survival (B) or cell death (D) was determined analyzing the % of cells with low or high PI staining, respectively. In C, alterations in mitochondrial activity were determined using the MTT assay. The effect of MnTBAP and MnTMPyP porphyrins on the survival of cells exposed to the parkinsonian mimetics was quantified by Calcein retention (E). Porphyrins were present throughout the experiment and concentrations used are indicated in µM. Data in B–E represent means ± SE of at least three replicas. *p<0.05 vs Ad-Empty + paraquat values.
Figure 4
Figure 4. Alterations in the redox state of cytosol and mitochondrial compartments in response to parkinsonian neurotoxins
In A, stable cells overexpressing roGFP and Mito-roGFP were stained with MitoTracker Red to depict mitochondrial localization of Mito-roGFP. In B, roGFP and Mito-roGFP cells were treated with paraquat, MPP+ or rotenone as indicated. Cells were co-stained with PI and only viable cells were analyzed (see population of PI- cells in the grey region of the histogram). Alterations in the redox state were determined by ratiometric analysis of changes in (Mito-)roGFP fluorescence at 407/488 ex and 530 em normalized with respect to control values. Data in graphs represent means ± SE of at least five independent experiments. *p<0.05 vs control values.
Figure 5
Figure 5. Relationship between cell death and alterations in the redox state of cytosol and mitochondria, and effect of SOD overexpression
In A and B, stable cells overexpressing roGFP and mito-roGFP were treated with 0.5 mM paraquat and 2.5 mM MPP+ for 48 h. Cells were co-stained with PI and only viable cells (PI-) were analyzed for alterations in (Mito-)roGFP fluorescence as explained in Figure 4. Cell death was plotted against (Mito-)roGFP ratio to depict the relationship between cell loss and alterations in the redox balance of the cytosol and mitochondrial compartments. In C and D, cells were transduced with Empty, MnSOD or CuZnSOD adenoviruses and treated 24 h after infection. Alterations in Mito-roGFP fluorescence were determined as explained before. In E and F, stable cells overexpressing roGFP and Mito-roGFP were treated with paraquat, MPP+ or rotenone as indicated. Cells were co-stained with PI and cell death was quantified as explained in Figure 3. Graphs represent means ± SE of at least five independent experiments. *p<0.05.
Figure 6
Figure 6. Determination of free radical formation, activation of ARE- and NF-κB-driven reporters, and lipid peroxidation induced by parkinsonian neurotoxins
In A–C, cells were treated with parkinsonian mimetics as depicted. Then, cells were loaded with the cell permeable spin probe CMH (200 µM, 60 min). After CMH incubation, cells were collected and EPR signal was detected in a Bruker e-scan EPR spectrometer. In A and C, EPR signal was normalized with the number of cells present after treatment and compared to control values. In B and C, cells were transduced with Empty, MnSOD or CuZnSOD adenoviruses and 24 h after infection, cells were treated with parkinsonian toxins (0.5 mM paraquat, 2.5 mM MPP+ or 4 uM rotenone) for 48 h. Data in B are representative EPR spectra from experiments in C. In D, human IMR-32 neuroblastoma cells were transfected with ARE-Gaussia, NF-κB-Cyrpidina, and CMV-Red Firefly reporter plasmids. 24 h after transfection, cells were treated for 5 h with paraquat, rotenone or MPP+ at the concentrations indicated. Then, luciferase activity was assessed in media (ARE) and lysate (NF-κB). Results are normalized by Red Firefly activity and expressed as RLUs. In E, lipid peroxidation was determined using the ratiometric probe BODIPY C11, whose emission fluorescence at 590 nm decreases with a concomitant in the fluorescent spectra at 530 nm in response to oxidation. Cells were treated as explained in C and incubated for 30 min prior to FACS analysis with BODIPY C11 (2.5 µM). Results were analyzed ratiometrically 530/590 em normalized with control values. Graphs represent means ± SE of at least 5 independent experiments. *p<0.05 vs Ad-Empty values.
FIGURE 7
FIGURE 7. MnSOD overexpression decreases cell death but mitochondrial membrane potential (ΔΨm) loss induced by paraquat
Cells were transduced with Empty adenovirus or adenovirus encoding MnSOD or CuZnSOD for 24 h prior exposure to parkinsonian toxins. In A, cells were treated with paraquat, MPP+ or rotenone for 48 h and stained with TMRM (50 nM) and Sytox Blue (5 nM) 15 min prior FACS analysis. Loss of ΔΨm and cell death were simultaneously analyzed in a TMRM vs Sytox Blue contour plot to depict cells with a decrease in ΔΨm (TMRM fluorescence, left quadrants) and loss of plasma membrane integrity (increased Sytox Blue uptake, upper quadrants). In B, % of cells with low Sytox Blue fluorescence and reduced TMRM signal depict live cells with ΔΨm depolarization (from broken line-lower left quadrants in A). Data in B represent means ± SE of at least three replicas. *p<0.05 vs Ad-Empty in the absence of treatment.

References

    1. Lees AJ. Unresolved issues relating to the shaking palsy on the celebration of James Parkinson's 250th birthday. Mov Disord. 2007;22(Suppl 17):S327–S334. - PubMed
    1. Alam ZI, Daniel SE, Lees AJ, Marsden DC, Jenner P, Halliwell B. A generalised increase in protein carbonyls in the brain in Parkinson's but not incidental Lewy body disease. J Neurochem. 1997;69:1326–1329. - PubMed
    1. Dexter DT, Carter CJ, Wells FR, Javoy-Agid F, Agid Y, Lees A, Jenner P, Marsden CD. Basal lipid peroxidation in substantia nigra is increased in Parkinson's disease. J Neurochem. 1989;52:381–389. - PubMed
    1. Alam ZI, Jenner A, Daniel SE, Lees AJ, Cairns N, Marsden CD, Jenner P, Halliwell B. Oxidative DNA damage in the parkinsonian brain: an apparent selective increase in 8-hydroxyguanine levels in substantia nigra. J Neurochem. 1997;69:1196–1203. - PubMed
    1. Horowitz MP, Greenamyre JT. Gene-environment interactions in Parkinson's disease: the importance of animal modeling. Clin Pharmacol Ther. 2010;88:467–474. - PMC - PubMed

Publication types

MeSH terms