. 2013 Jul:112:57-67.
doi: 10.1016/j.exer.2013.04.006. Epub 2013 Apr 18.

Formation of lipofuscin-like material in the RPE Cell by different components of rod outer segments

Affiliations

Formation of lipofuscin-like material in the RPE Cell by different components of rod outer segments

Lei Lei et al. Exp Eye Res. 2013 Jul.

Abstract

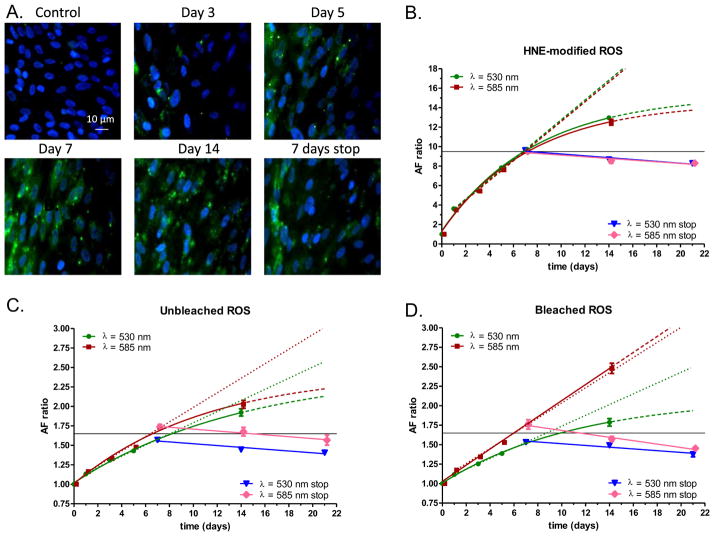
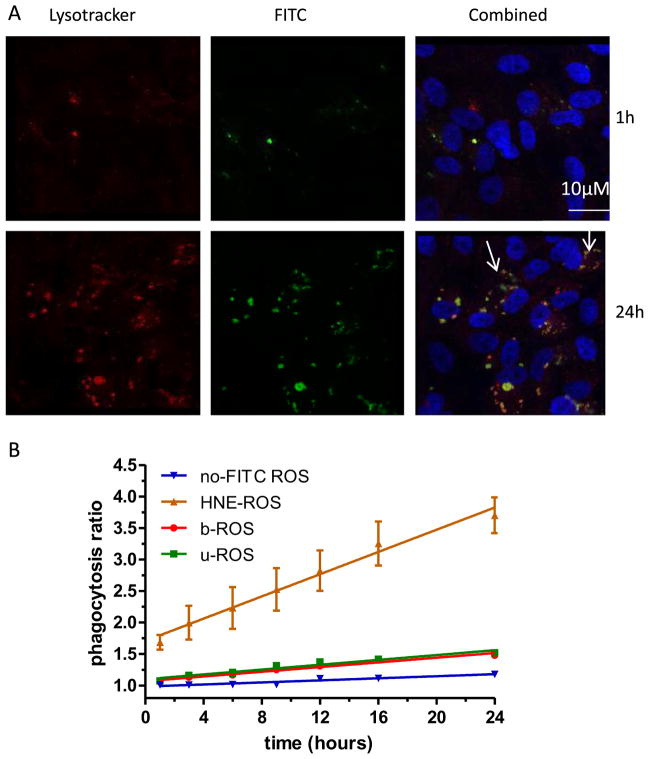
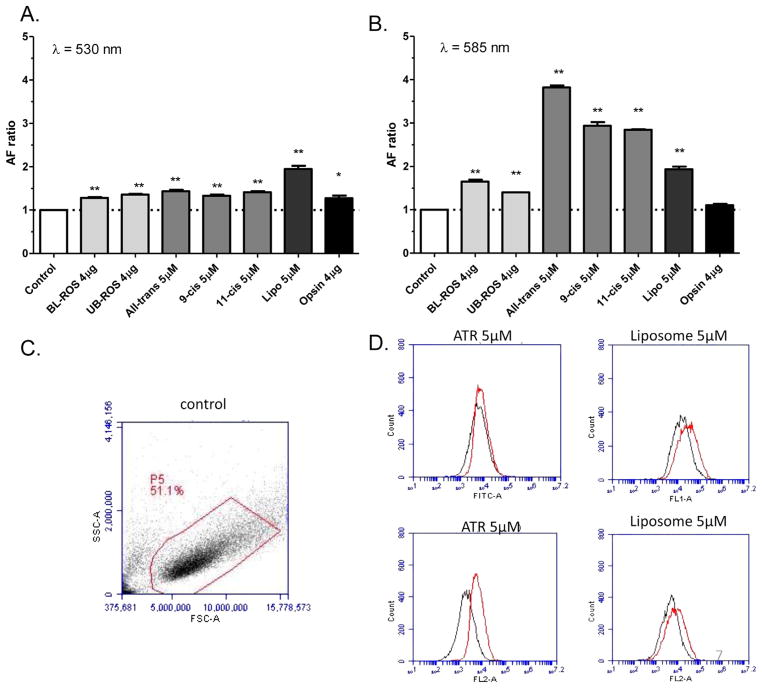
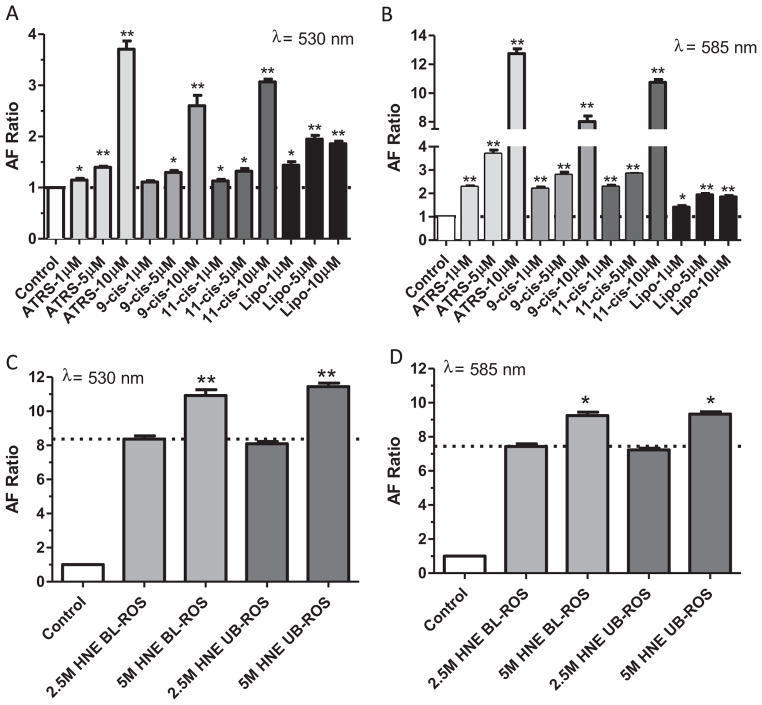
The mechanisms that control the natural rate of lipofuscin accumulation in the retinal pigment epithelial (RPE) cell and its stability over time are not well understood. Similarly, the contributions of retinoids, phospholipids and oxidation to the rate of accumulation of lipofuscin are uncertain. The experiments in this study were conducted to explore the individual contribution of rod outer segments (ROS) components to lipofuscin formation and its accumulation and stability over time. During the period of 14 days incubation of ROS, lipofuscin-like autofluorescence (LLAF) determined at two wavelengths (530 and 585 nm) by fluorescence-activated cell sorting (FACS) was measured from RPE cells. The autofluorescence increased in an exponential manner with a strong linear component between days 1 and 7. The magnitude of the increase was larger in cells incubated with 4-hydroxynonenal (HNE-ROS) compared with cells incubated with either bleached or unbleached ROS, but with a different spectral profile. A small (10-15%) decrease in LLAF was observed after stopping the ROS feeding for 14 days. The phagocytosis rate of HNE-ROS was higher than that of either bleached or unbleached ROS during the first 24 h of supplementation. Among the different ROS components, the increase of LLAF was highest in cells incubated with all-trans-retinal. Surprisingly, incubation with 11-cis-retinal and 9-cis-retinal also resulted in strong LLAF increase, comparable to the increase induced by all-trans-retinal. Supplementation with liposomes containing phosphatidylethanolamine (22: 6-PE) and phosphatidylcholine (18:1-PC) also increased LLAF, while incubation with opsin had little effect. Cells incubated with retinoids demonstrated strong dose-dependence in LLAF increase, and the magnitude of the increase was 2-3 times higher at 585 nm compared to 530 nm, while cells incubated with liposomes showed little dose-dependence and similar increase at both wavelengths. Very little difference in LLAF was noted between cells incubated with either unbleached or bleached ROS under any conditions. In summary, results from this study suggest that supplementation with various ROS components can lead to an increase in LLAF, although the autofluorescence generated by the different classes of components has distinct spectral profiles, where the autofluorescence induced by retinoids results in a spectral profile closest to the one observed from human lipofuscin. Future fluorescence characterization of LLAF in vitro would benefit from an analysis of multiple wavelengths to better match the spectral characteristics of lipofuscin in vivo.


Figures

Fig. 1
Fig. 1
Autofluorescence of RPE cells following feeding with either bleached, unbleached, or HNE-modified ROS at different time points. A: Changes in RPE cells after incubation with unbleached ROS evaluated by fluorescence microscopy. Representative examples of cells in control condition (no feeding), at Day 3 and at Day 5 during incubation are presented on the top row. Representative examples of cells at Day 7 and at Day 14 during incubation and at 7 days post the end of the 14 day incubation period (7 days stop) are presented on the bottom row. The original magnification used for all micrographs was ×400. BD: Time course of mean autofluorescence change in RPE cells (AF ratio) during and after incubation with HNE-modified ROS (B), unbleached ROS (C) or bleached ROS (D) detected at 533 and 585 nm. The green and red symbols indicate AF ratio from Day 1 to Day 14 at 530 nm and at 585 nm, respectively. The blue and pink symbols indicate AF ratios at 530 and 585 nm respectively, for the period Day 7 to Day 21, when no incubation took place (530 stop and 585 nm stop). Exponential curve fitting is indicated with green and red solid lines for 530 and 585 nm, respectively, and extrapolation until Day 21 is presented with dashed lines. A linear regression model (Day 1 to Day 7) is indicated with the same colors and solid lines, while the extrapolation until Day 21 is indicated with dotted lines. Similarly, a linear regression model is presented with sold blue and pink lines for 530 and 585 nm. Symbols represent average values of relative autofluorescence (AF ratio) ±SEM, whereas horizontal thin solid line indicates the level of autofluorescence at Day 7. For more details see the main text.
Fig. 2
Fig. 2
Kinetics of ROS phagocytosis by RPE cells in vitro. A: Confocal micrographs of ARPE-19 cells stained with either the fluorescent acidotropic probe Lysotracker Red (left panels) or with FITC-modified HNE-ROS (central panels). The right panels represent a combination of the two stains. Micrographs taken at 24 h (bottom row) demonstrate the presence of more lysosomes co-localized with FITC-labeled ROS, as indicated by white arrows. B: Time course of autofluorescence change generated by RPE phagocytosis of FITC-labeled ROS at various time points during the 24 h period after single feeding with 4 μg/cm2 of four different types of ROS: Uunbleached ROS labeled with FITC, bleached ROS labeled with FITC, HNE-modified ROS labeled with FITC or unbleached ROS not labeled with FITC. The symbols indicate mean values of phagocytosis (±SEM) normalized to non-fed cells. The autofluorescence was detected and quantified by FACS in the FITC channel (530 nm).
Fig. 3
Fig. 3
Transmissions electron microscopy of ARPE-19 cell one hour after feeding with bleached ROS. A: Electron micrographs of ARPE-19 cells fixed at 1 h post-feeding with bleached ROS at 4 μg/cm2. White arrow indicates a large intracellular inclusion body. Magnification: ×2550; B: Higher magnification of the intracellular inclusion body presented in A. Magnification: ×4200. Abbreviations: N – nucleus, M – mitochondria.
Fig. 4
Fig. 4
Autofluorescence of ARPE-19 cells following 7 day feeding with different preparations A: FACS analysis in FITC channel (detection filter wavelength, 533/30 nm) of the different groups presented in cells fed with different preparations. B: FACS analysis for the same conditions as in A, but in PE channel (detection filter wavelength, 585/40 nm); C: Representative example of a density plot (forward scatter vs. side scatter) from the FACS analysis under control conditions; the gate (red polygonal line) was set to exclude cell debris and cell clusters. D: Histograms for some of the data presented on panels A and B. Top row: histograms of control conditions (black traces) and test conditions (red traces) in the FITC channel. From left to right: all-trans-retinal condition, liposome condition. Bottom row: histograms of same conditions as in the top row, but recorded in the PE channel. Asterisks above bar graphs in A and B indicate statistical significance between the average LLAF in the control condition and the relative LLAF from cells fed with different components (one-sample t-test; *p < 0.05; **p < 0.01).
Fig. 5
Fig. 5
Effect of retinoids and liposomes on RPE cell autofluorescence. A: Average LLAF of ARPE-19 cells examined by FACS following 7 days feeding with increasing concentration of retinoids and liposomes at the FITC channel (excitation 488 nm, emission 533/30 nm). B: Same conditions as in A, but autofluorescence was detected at the PE channel (emission 585/40 nm). C: Average LLAF of ARPE-19 cells following 7 days feeding with different ratio of liposome and ROS. D: Average LLAF of ARPE-19 cells following 7 days feeding with 2 different concentrations of HNE-modified ROS (2.5 mM or 5 mM) under bleached or unbleached conditions.

References

    1. Bazan HE, Bazan NG, Feeney-Burns L, Berman ER. Lipids in human lipofuscin-enriched subcellular fractions of two age populations. Comparison with rod outer segments and neural retina. Investigative Ophthalmology & Visual Science. 1990;31:1433–1443. - PubMed
    1. Ben-Shabat S, Parish CA, Vollmer HR, Itagaki Y, Fishkin N, Nakanishi K, Sparrow JR. Biosynthetic studies of A2E, a major fluorophore of retinal pigment epithelial lipofuscin. The Journal of Biological Chemistry. 2002;277:7183–7190. - PubMed
    1. Boulton M, McKechnie NM, Breda J, Bayly M, Marshall J. The formation of autofluorescent granules in cultured human RPE. Investigative Ophthalmology & Visual Science. 1989;30:82–89. - PubMed
    1. Boyer NP, Higbee D, Currin MB, Blakeley LR, Chen C, Ablonczy Z, Crouch RK, Koutalos Y. Lipofuscin and N-retinylidene-N-retinylethanolamine (A2E) accumulate in the retinal pigment epithelium in the absence of light exposure: their origin is 11-C is retinal. The Journal of Biological Chemistry 2012 - PMC - PubMed
    1. Delori F, Greenberg JP, Woods RL, Fischer J, Duncker T, Sparrow J, Smith RT. Quantitative measurements of autofluorescence with the scanning laser ophthalmoscope. Investigative Ophthalmology & Visual Science. 2011;52:9379–9390. - PMC - PubMed

Publication types

MeSH terms