. 2013 Jun 5:123:1-12.
doi: 10.1016/j.jphotobiol.2013.03.007. Epub 2013 Mar 28.

UVA causes dual inactivation of cathepsin B and L underlying lysosomal dysfunction in human dermal fibroblasts

Affiliations

UVA causes dual inactivation of cathepsin B and L underlying lysosomal dysfunction in human dermal fibroblasts

Sarah D Lamore et al. J Photochem Photobiol B. .

Abstract

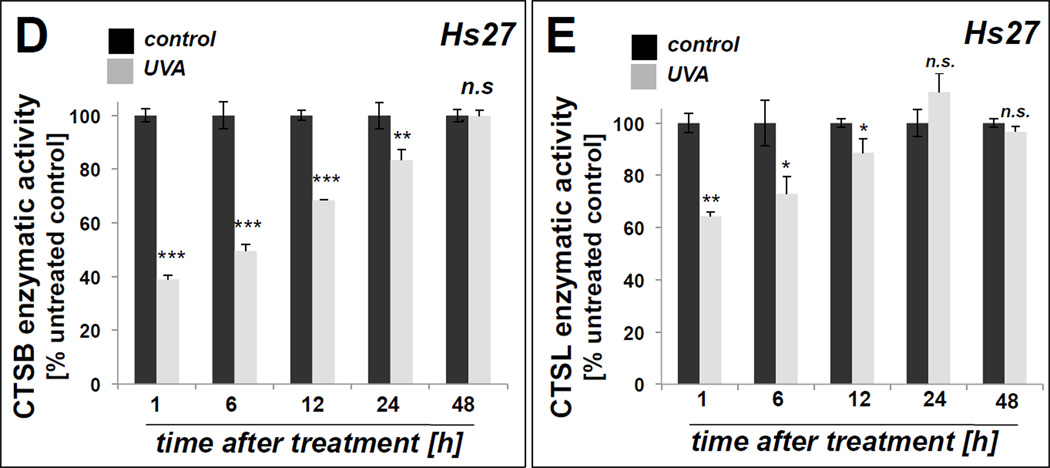
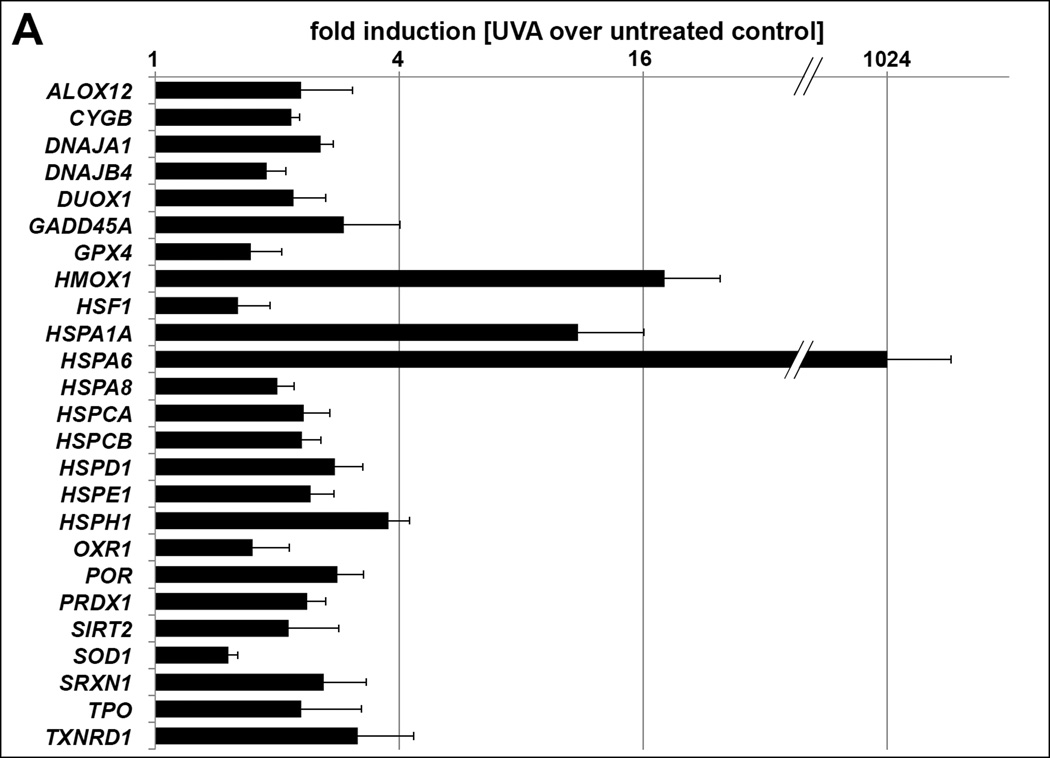
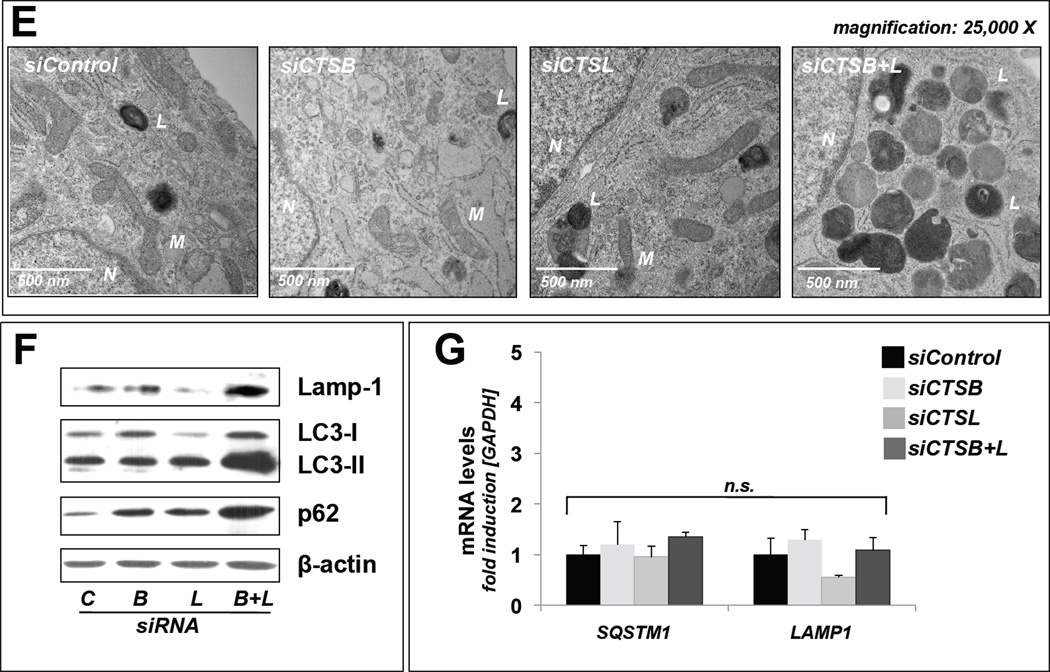
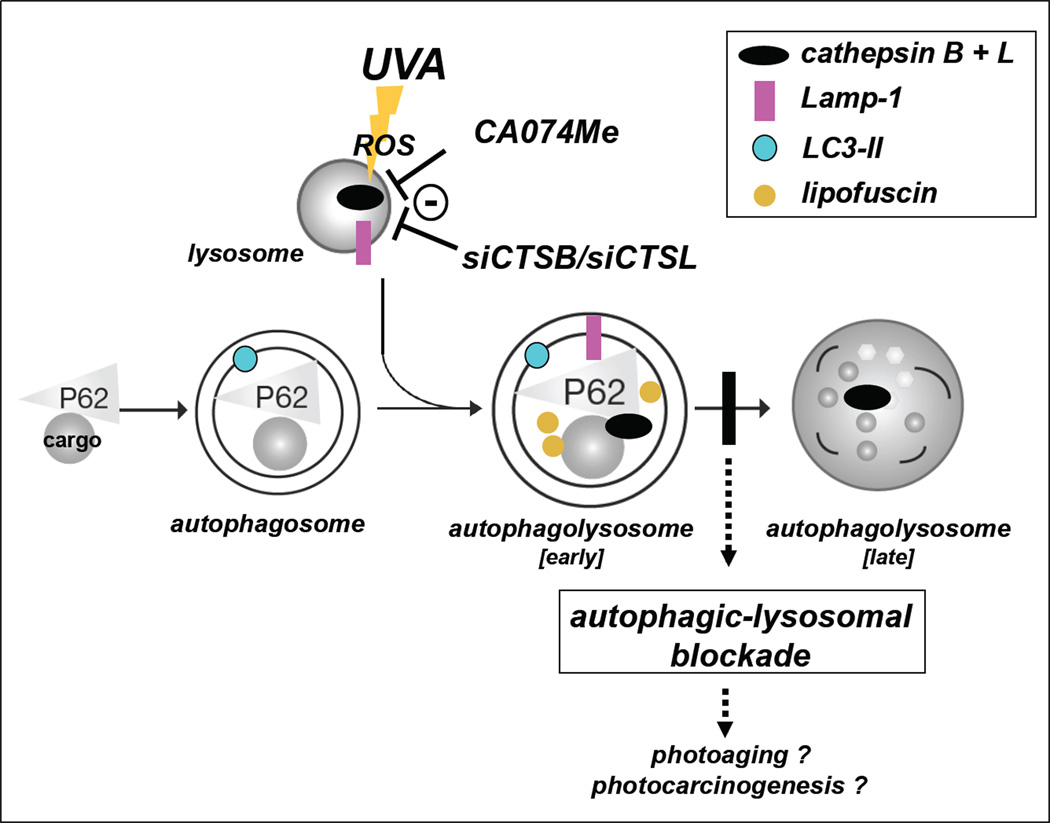
Cutaneous exposure to chronic solar UVA-radiation is a causative factor in photocarcinogenesis and photoaging. Recently, we have identified the thiol-dependent cysteine-protease cathepsin B as a novel UVA-target undergoing photo-oxidative inactivation upstream of autophagic-lysosomal dysfunction in fibroblasts. In this study, we examined UVA effects on a wider range of cathepsins and explored the occurrence of UVA-induced cathepsin inactivation in other cultured skin cell types. In dermal fibroblasts, chronic exposure to non-cytotoxic doses of UVA caused pronounced inactivation of the lysosomal cysteine-proteases cathepsin B and L, effects not observed in primary keratinocytes and occurring only to a minor extent in primary melanocytes. In order to determine if UVA-induced lysosomal impairment requires single or dual inactivation of cathepsin B and/or L, we used a genetic approach (siRNA) to selectively downregulate enzymatic activity of these target cathepsins. Monitoring an established set of protein markers (including LAMP1, LC3-II, and p62) and cell ultrastructural changes detected by electron microscopy, we observed that only dual genetic antagonism (targeting both CTSB and CTSL expression) could mimic UVA-induced autophagic-lysosomal alterations, whereas single knockdown (targeting CTSB or CTSL only) did not display 'UVA-mimetic' effects failing to reproduce the UVA-induced phenotype. Taken together, our data demonstrate that chronic UVA inhibits both cathepsin B and L enzymatic activity and that dual inactivation of both enzymes is a causative factor underlying UVA-induced impairment of lysosomal function in dermal fibroblasts.


Figures

Figure 1
Figure 1. UVA modulation of cathepsin B and cathepsin L specific enzymatic activity in cultured human skin cell types
Skin cells were exposed to UVA (‘1 week’ regimen). After completion of the UVA regimen, viability was determined by flow cytometric analysis of annexin V-propidium iodide stained cells (left panels; numbers indicate % viable of total gated cells; n=3, mean ± SD). (A) UVA-modulation of cathepsin B, cathepsin L, cathepsin D, and GAPDH enzymatic activities in human dermal fibroblasts. (B) UVA-modulation of cathepsin B and cathepsin L enzymatic activities in human primary keratinocytes (HEK). (C) UVA-modulation of cathepsin B and cathepsin L enzymatic activities in human primary melanocytes (HEMa). (D) Recovery kinetics (assessed at 1–48 h after last UVA exposure) of cathepsin B activity in human dermal fibroblasts. (E) Recovery kinetics (assessed at 1–48 h after last UVA exposure) of cathepsin L activity in human dermal fibroblasts. All bar graphs represent data as means ± SD (n=3).
Figure 2
Figure 2. UVA-induced upregulation of oxidative/proteotoxic stress responses and proteasomal activity in dermal fibroblasts
(A) UVA-modulation of stress response gene expression as assessed by quantitative RT-PCR using the Stress and Toxicity Pathway Finder™ array technology. The bar graph depicts statistically significant differences (n=3; p < 0.05) between UVA-exposed and untreated groups. (B) Immunoblot analysis of cellular stress response protein levels; β-actin: loading control. (C) Antioxidant modulation of cathepsin (CTSB, CTSL, CTSD) enzymatic activities in human dermal fibroblasts exposed to UVA (‘1 week’ regimen) in the presence or absence of NAC (10 mM). (D) 4-HNE adduct formation targeting cathepsin B in fibroblasts exposed to chronic UVA. Human dermal fibroblasts were lysed following chronic UVA or mock treatment as specified in Materials and methods. Cathepsin B was immunoprecipitated (IP) and immunoblot (IB) analysis of 4-HNE adduction was performed (top panel). As a loading control, IB analysis of cathepsin B [double chain (DC) and single chain (SC) form; bottom pabel] was performed from equal portions of cell lysates as used for immunoprecipitation. (E) Analysis of proteasome enzymatic activities [chymotrypsin-like, trypsin-like, and caspase (PGPH)-like] one hour after single (9.9 J/cm2) or cumulative UVA exposure (‘1 week’ regimen). Treatment with MG132 (10 µM, 6 h) served as a positive control. All bar graphs represent data as means ± SD (n=3). Gene symbols and names: ALOX12: Arachidonate 12-lipoxygenase; CYGB: Cytoglobin; CYP2E1: Cytochrome P450, family 2, subfamily E, polypeptide 1; DNAJA1: DnaJ (Hsp40) homolog, subfamily A, member 1; DNAJB4: DnaJ (Hsp40) homolog, subfamily B, member 4; DUOX1: Dual oxidase 1; GADD45A: Growth arrest and DNA-damage-inducible, alpha; GDF15: Growth differentiation factor 15; GPX4: Glutathione peroxidase 4 (phospholipid hydroperoxidase); HMOX1: Heme oxygenase (decycling) 1; HSF1: Heat shock transcription factor 1; HSPA1A: Heat shock 70kDa protein 1A; HSPA6: Heat shock 70kDa protein 6 (HSP70B'); HSPA8: Heat shock 70kDa protein 8; HSPCA: Heat shock protein 90kDa alpha (cytosolic), class A member 2; HSPCB: Heat shock protein 90kDa alpha (cytosolic), class B member 1; HSPD1: Heat shock 60kDa protein 1 (chaperonin); HSPE1: Heat shock 10kDa protein 1 (chaperonin 10); HSPH1: Heat shock 105kDa/110kDa protein 1; OXR1: Oxidation resistance 1; POR: P450 (cytochrome) oxidoreductase; PRDX1: Peroxiredoxin 1; SIRT2: Sirtuin 2; SOD1: Superoxide dismutase 1, soluble; SRXN1: Sulfiredoxin 1; TPO: Thyroid peroxidase; TXNRD1: Thioredoxin reductase 1.
Figure 3
Figure 3. UVA-induced autophagic-lysosomal dysfunction in dermal fibroblasts is mimicked using CTSB-/CTSL-directed dual pharmacological inhibition
(A) After exposure to UVA (‘1 week’ regimen), CA074Me (1µM, q.d., 4 consecutive days), or mock treatment (control) lysosomal alterations were visualized by transmission electron microscopy (TEM): L (Osmiophilic vesicles indicative of lysosomal lipofuscin accumulation; M (mitochondrion); N (nucleus). (B and C) Immunoblot detection of autophagic-lysosomal marker proteins (Lamp-1, LC3-I, LC3-II, p62; β-actin: loading control) in the treatment groups (panel B: control, UVA; panel C: control, CA074Me) as observed earlier [29]. (D) Inhibitory profile of CA074Me on cathepsin B, cathepsin L, and cathepsin D enzymatic activities as assessed in fibroblasts exposed to CA074Me (1µM, q.d., 4 consecutive days). All bar graphs represent data as means ± SD (n=3).
Figure 4
Figure 4. UVA-induced lysosomal dysfunction is mimicked only by dual but not single siRNA-based genetic antagonism targeting CTSB and CTSL in dermal fibroblasts
(A–C) Confirmation of cathepsin specific expression knockdown: (A) Cathepsin B and cathepsin L enzymatic activities as assessed in fibroblasts after transfection with (i) siControl, (ii) siCTSB, (iii) siCTSL, or (iv) siCTSB ± siCTSL. (B) mRNA transcript levels detected by quantitative RT-PCR of CTSB and CTSL; groups as in (A). (C) Immunoblot detection of cellular cathepsin B and cathepsin L protein levels [double chain (DC) and single chain (SC) form]; groups as in (A); β-actin: loading control. (D–E) Lysosomal alterations in treatment groups versus untreated control as visualized by transmission electron microscopy (magnification, D: 10,000 ×; E: 25,000 ×). L (Osmiophilic vesicles indicative of lysosomal lipofuscin accumulation; M (mitochondrion); N (nucleus). (F). Immunoblot detection of autophagic-lysosomal marker proteins (Lamp-1, LC3-I, LC3-II, p62); groups as in (A); β-actin: loading control. (G) mRNA transcript levels of genes encoding autophagic-lysosomal markers (LAMP1, SQSTM1) detected by quantitative RTP-CR; groups as in (A). All bar graphs represent data as means ± SD (n=3).
Figure 5
Figure 5. Cathepsin B and L as critical molecular targets of UVA-induced cutaneous photooxidative stress impairing autophagic-lysosomal function
Our data suggest that inactivation of cysteine-dependent, redox-sensitive lysosomal proteases (cathepsin B and L) may occur as a consequence of (i) UVA-induced photooxidative stress mediated through reactive oxygen species (ROS) or (ii) pharmacological (CA074Me) or (iii) genetic (siCTSB/siCTSL) antagonism, causing autophagic-lysosomal blockade in human dermal fibroblasts. In the early autophagolysosome, formed upon fusion between lysosome and autophagosome, loss of cathepsin B and L enzymatic activity causes lysosomal expansion and induces accumulation of Lamp-1, LC3-II, and autophagic cargo proteins (e.g. p62). The vertical black bar indicates the resulting autophagic-lysosomal blockade suppressing the formation of late autophagolysosomes. Dysfunctional and peroxidized cargo that remains undigested now forms autofluorescent lipofuscin pigments that further compromise lysosomal function. The potential role of cathepsin B/L inhibition induced by chronic UVA exposure in cutaneous photoaging and photocarcinogenesis remains to be established.

References

    1. de Laat A, van der Leun JC, de Gruijl FR. Carcinogenesis induced by UVA (365-nm) radiation: the dose-time dependence of tumor formation in hairless mice. Carcinogenesis. 1997;18:1013–1020. - PubMed
    1. Wlaschek M, Tantcheva-Poor I, Naderi L, Ma W, Schneider LA, Razi-Wolf Z, Schuller J, Scharffetter-Kochanek K. Solar UV irradiation and dermal photoaging. J Photochem Photobiol B. 2001;63:41–51. - PubMed
    1. Runger TM. How different wavelengths of the ultraviolet spectrum contribute to skin carcinogenesis: the role of cellular damage responses. J Invest Dermatol. 2007;127:2103–2105. - PubMed
    1. Cadet J, Douki T, Ravanat JL, Di Mascio P. Sensitized formation of oxidatively generated damage to cellular DNA by UVA radiation. Photochem Photobiol Sci. 2009;8:903–911. - PubMed
    1. Zastrow L, Groth N, Klein F, Kockott D, Lademann J, Renneberg R, Ferrero L. The missing link--light-induced (280-1,600 nm) free radical formation in human skin. Skin Pharmacol Physiol. 2009;22:31–44. - PubMed

Publication types

MeSH terms

LinkOut - more resources