. 2013 Aug 15:245:74-89.
doi: 10.1016/j.neuroscience.2013.04.016. Epub 2013 Apr 16.

Cyclic AMP stimulates neurite outgrowth of lamprey reticulospinal neurons without substantially altering their biophysical properties

Affiliations

Cyclic AMP stimulates neurite outgrowth of lamprey reticulospinal neurons without substantially altering their biophysical properties

T Pale et al. Neuroscience. .

Abstract

Reticulospinal (RS) neurons are critical for initiation of locomotor behavior, and following spinal cord injury (SCI) in the lamprey, the axons of these neurons regenerate and restore locomotor behavior within a few weeks. For lamprey RS neurons in culture, experimental induction of calcium influx, either in the growth cone or cell body, is inhibitory for neurite outgrowth. Following SCI, these neurons partially downregulate calcium channel expression, which would be expected to reduce calcium influx and possibly provide supportive conditions for axonal regeneration. In the present study, it was tested whether activation of second messenger signaling pathways stimulates neurite outgrowth of lamprey RS neurons without altering their electrical properties (e.g. spike broadening) so as to possibly increase calcium influx and compromise axonal growth. First, activation of cAMP pathways with forskolin or dbcAMP stimulated neurite outgrowth of RS neurons in culture in a PKA-dependent manner, while activation of cGMP signaling pathways with dbcGMP inhibited outgrowth. Second, neurophysiological recordings from uninjured RS neurons in isolated lamprey brain-spinal cord preparations indicated that dbcAMP or dbcGMP did not significantly affect any of the measured electrical properties. In contrast, for uninjured RS neurons, forskolin increased action potential duration, which might have increased calcium influx, but did not significantly affect most other electrical properties. Importantly, for injured RS neurons during the period of axonal regeneration, forskolin did not significantly alter their electrical properties. Taken together, these results suggest that activation of cAMP signaling by dbcAMP stimulates neurite outgrowth, but does not alter the electrical properties of lamprey RS neurons in such a way that would be expected to induce calcium influx. In conclusion, our results suggest that activation of cAMP pathways alone, without compensation for possible deleterious effects on electrical properties, is an effective approach for stimulating axonal regeneration of RS neuron following SCI.


Figures

Figure 1
Figure 1
(upper) Diagram of dorsal view of a larval lamprey brain (left) and rostral spinal cord showing the transections (dotted lines) where the brain was cut into blocks for neuronal cell culture (see Experimental procedures). Contours represent cell groups containing descending brain neurons that project to the spinal cord (see Davis and McClellan, 1994a,b). Reticulospinal (RS) neurons, which account for 80% of descending brain neurons, are located in the mesencephalic reticular nucleus (MRN) and the anterior (ARRN), middle (MRRN) and posterior (PRRN) rhombencephalic reticular nuclei. Other descending brain neurons are located in the anterolateral (ALV), dorsolateral (DLV), and posterolateral (PLV) vagal groups. (lower) Enlargement of reticular nuclei showing large, uniquely identifiable RS neurons (Müller cells) in the MRN (M1–M3), ARRN (I1–I4), and MRRN (B1–B5). The Mauthner (Mau) and auxiliary Mauthner (AM) cells are located in the MRRN. Unidentified neurons are omitted for simplicity.
Figure 2
Figure 2
(A) Sequential images (A1–A4), each separated by ~36 min, showing a DiI-labeled descending brain neuron (arrows indicate cell body) whose associated neurite, which terminated in a growth cone (arrowheads), extended during the Pre-Control period (compare arrowhead and dotted line in A4). Scale bar = 50 μm. (B) Histogram displaying the relative distributions of the initial neurite length-to-cell body diameter ratios for all neurons from the Pre-Control periods for dbcAMP, forskolin, and IBMX (n = 139 neurites). For most neurons in culture, the neurite length was 2–4 times the cell body diameter.
Figure 3
Figure 3
Activation of cAMP pathways stimulated neurite outgrowth of lamprey descending brain neurons, 80% of which are RS neurons. Average neurite outgrowth rates (bars = means, vertical lines = SDs) prior to addition of agents (Pre-Control, open bars, 120 min), and during the presence of (A) 10 mM dbcAMP, (B) 100 μM forskolin, or (C) 100 μM IBMX (Experimental, black filled bars, 120 min). Outgrowth rates for neurites that were retracting (left pairs of bars) or extending (right pairs of bars) during the Pre-Control period. The ratios beside each filled bar indicate the fraction of neurites that responded to a given agent in the same way (extension or retraction) as the overall average effect. Statistics: paired t-test for neurite outgrowth rates between Pre-Control and dbcAMP, forskolin, or IBMX; NS = not significantly different.
Figure 4
Figure 4
Blocking PKA inhibited neurite outgrowth. Average neurite outgrowth rates (bars = means, vertical lines = SDs) prior to addition of agents (Pre-Control, open bars, 120 min), and during the presence of (A) 10 μM H89, (B) 10 μM 1NM-PP1, or (C) 30 μM PKI(14–22) (Experimental, black bars, 120 min); NS = not significantly different. See Fig. 3 legend for additional explanation.
Figure 5
Figure 5
Activation of cGMP inhibited neurite outgrowth. Average neurite outgrowth rates (bars = means, vertical lines = SDs) prior to addition of dbcGMP (Pre-Control, open bars, 120 min), and in the presence of 10 mM dbcGMP (Experimental, black bars, 120 min); NS = not significantly different. See Fig. 3 legend for additional explanation.
Figure 6
Figure 6
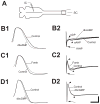
The agents dbcAMP or dbcGMP, unlike forskolin, did not alter action potential properties of uninjured, identified RS neurons (also see Fig. 7). (A) Isolated brain-spinal cord preparation showing the brain (left), and rostral spinal cord, intracellular recording micropipette (IC), and suction electrode around the caudal end of the spinal cord (SC) (see Experimental procedures). (B) (B1) Action potentials from a right uninjured “I1 cell” (see Fig. 1) for control conditions and in the presence of 10 mM dbcAMP. (B2) Control and dbcAMP traces from the same neuron as in panel B1 showing afterpotentials with three components: fast after hyperpolarization (fAHP); after depolarization (ADP); and slow AHP (sAHP). (C) (C1) Action potentials for a right uninjured “B3 cell” (see Fig. 1) under control conditions and in the presence of 50 M forskolin. (C2) Control and forskolin recordings from the same neuron as in panel C1 showing afterpotential components. (D) (D1) Action potentials (control and 10 mM dbcGMP) from a right uninjured “B4 cell”. (D2) Control and dbcGMP traces from the same neuron as in panel D1 showing afterpotential components. For B1, C1 and D1, the x,y coordinates of the raw action potential traces were imported into Excel (Microscoft; Seattle, WA) and plotted with the smoothing line tool to extrapolate between the sample points, which were acquired at 10 kHz. Scale Bars: (vertical/horizontal) 30 mV/1 ms (B1, C1, D1); 3 mV/50 ms (B2, C2, D2).
Figure 7
Figure 7
Normalized ratio values (see Experimental procedures) for various components of action potentials and passive membrane properties of uninjured, identified RS neurons before and after application of 10 mM dbcAMP (gray bars), 50 μM forskolin (open bars), or 10 mM dbcGMP (black bars). Normalized ratio values = drug ratios / vehicle ratios. Bars = means, vertical lines = SDs. Statistics: unpaired t-test (for each parameter, drug ratio values were compared to vehicle ratio values; see Experimental procedures) *- p ≤ 0.05, ** - p ≤ 0.01, *** - p ≤ 0.001.
Figure 8
Figure 8
Activation of second messenger signaling pathways with dbcAMP, forkolin, or dbcGMP did not appear to alter firing patterns of uninjured RS neurons. (A) Isolated brain-spinal cord preparation (see legend for Fig. 6A). (B,C,D) Membrane potential (V), current (I), and instantaneous firing frequency (F). (B) Firing patterns for a right “I1 cell” in response to a 2 s depolarizing current pulse before (B1) and after (B2) application of 10 mM dbcAMP. (C) Firing pattern of left “B3 cell” before (C1) and after (C2) application of 50 μM forskolin. (D) Firing patterns of a different right “I1 cell” before (D1) and after (D2) application of 10 mM dbcGMP. Scale bars: (vertical) 75 mV/6 nA/5 Hz / (horizontal) 500 ms.
Figure 9
Figure 9
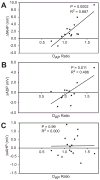
Correlation analysis of voltage shifts (Δ) of the peaks of the various afterpotential components vs. the DAP ratios (forskolin / Ringer’s) for uninjured RS neurons. (A) ΔfAHP (n = 14 neurons), (B) ΔADP (n = 11), and (C) ΔsAHP (n = 16) vs. DAP ratios. In the presence of forskolin, larger increases in the DAP ratios were correlated with depolarizing shifts in the peaks of the fAHP and ADP, but with little effect on the peaks of the sAHP.
Figure 10
Figure 10
Activation of cAMP signaling in injured RS neurons did not substantially alter action potential properties and firing patterns. (A) Isolated brain-spinal cord preparation showing the brain (left), and rostral spinal cord, double hemi-transections (HTs; see Experimental procedures) at 10% BL (2–3 wks post-lesion), intracellular recording micropipette (IC), suction electrode on the dorsal surface of the spinal cord above the HTs (SC1), and suction electrode around the caudal end of the spinal cord below the HTs (SC2) (see Experimental procedures). (B) (B1) Action potential traces from a left injured “B3 cell” before and after application of 50 μM forskolin. (B2) Superimposed control and forskolin traces from the same neuron as in panel B1, showing only the fAHP. (C) Membrane potential (V), current (I), and firing frequency (F). Firing of an injured left “B3 cell” (same cell as in B) in response to a 2 s depolarizing current pulse before (C1) and after (C2) application of 50 μM forskolin. Scale bars: (vertical/horizontal) (B1) 30 mV/2 ms, (B2) 5 mV/95 ms. (C1, C2) (vertical) 20 mV/10 nA/30 Hz / (horizontal) 1 s.
Figure 11
Figure 11
(A) Summary of action potential components and passive membrane properties of injured, identified RS neurons before and after application of 50 μM forskolin. Normalized ratio values = drug ratios / vehicle ratios (see Experimental procedures). Bars = means, vertical lines = SDs. Statistics: unpaired t-test (for each parameter, the drug ratios were compared to vehicle ratios; see Experimental procedures). There were no significant changes in response to forskolin. Note that the ADP and sAHP often are absent in injured lamprey RS neurons. (B) In contrast to uninjured RS neurons (Fig. 9), for injured, identified RS neurons (n = 17 neurons), forskolin did not result in voltage shifts in the peaks of the fAHP (ΔfAHP) that were correlated with the DAP ratios.

Similar articles

Cited by

References

    1. Ansanay H, Dumuis A, Sebben M, Bockaert J, Fagni L. cAMP-dependent, long-lasting inhibition of a K+ current in mammalian neurons. Proc Natl Acad Sci USA. 1995;92:6635–6639. - PMC - PubMed
    1. Bain J, Plater L, Elliot M, Shpiro N, Hastie CJ, McLauchlan H, Klevernic I, Arthur JSC, Alessi DR, Cohen P. The selectivity of protein kinase inhibitors: A further update. Biochem J. 2007;408:297–315. - PMC - PubMed
    1. Bandtlow CE, Schmidt MF, Hassinger TD, Schwab ME, Kater SB. Role of intracellular calcium in NI-35 evoked collapse of neuronal growth cones. Science. 1993;259:80–83. - PubMed
    1. Bernau NA, Puzdrowski RL, Leonard RB. Identification of the midbrain locomotor region and its relation to descending locomotor pathways in the Atlantic stingray, Dasyatis sabina. Brain Res. 1991;557:83–94. - PubMed
    1. Bhatt DH, Otto SJ, Depoister B, Fetcho JR. Cyclic AMP-induced repair of zebrafish spinal circuits. Science. 2004;305:254–258. - PubMed

Publication types

LinkOut - more resources