. 2013 Jun;16(6):724-9.
doi: 10.1038/nn.3382. Epub 2013 Apr 21.

Adaptation maintains population homeostasis in primary visual cortex

Affiliations

Adaptation maintains population homeostasis in primary visual cortex

Andrea Benucci et al. Nat Neurosci. 2013 Jun.

Abstract

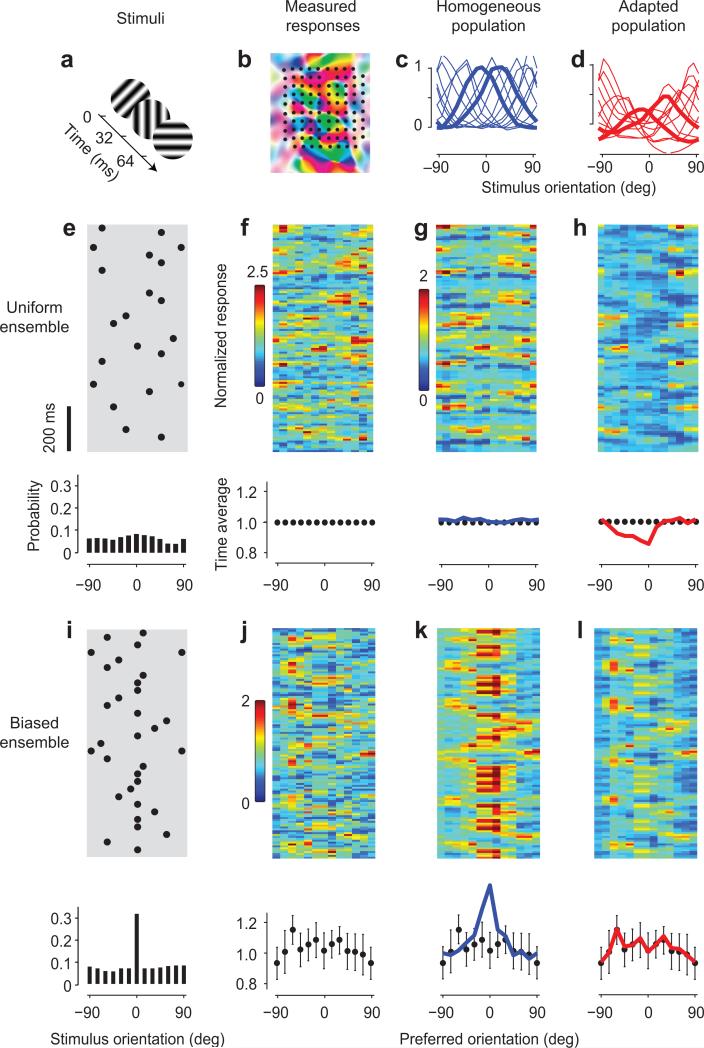
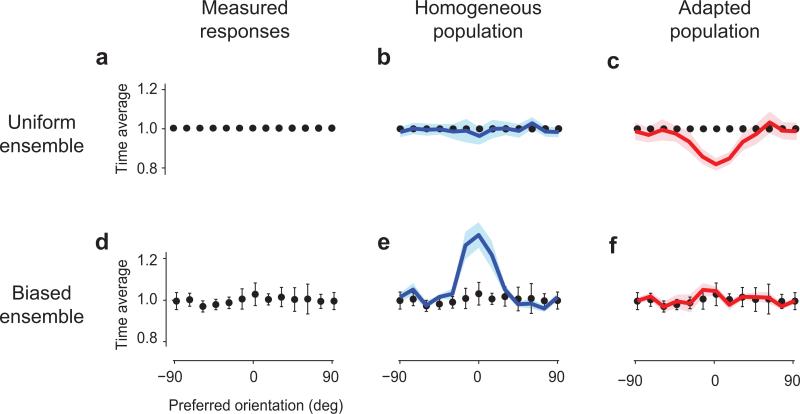
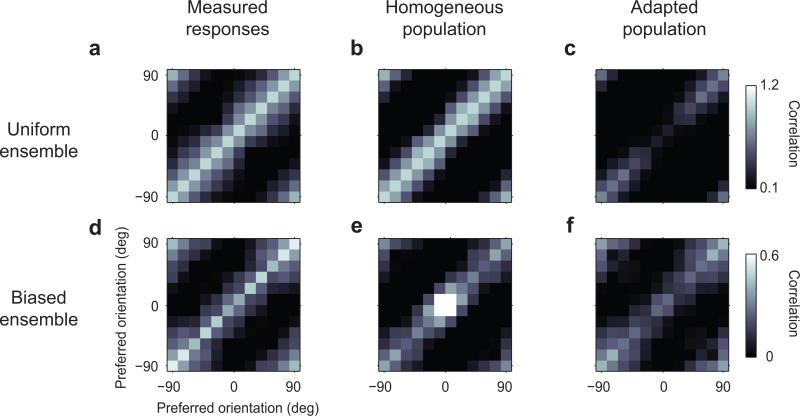
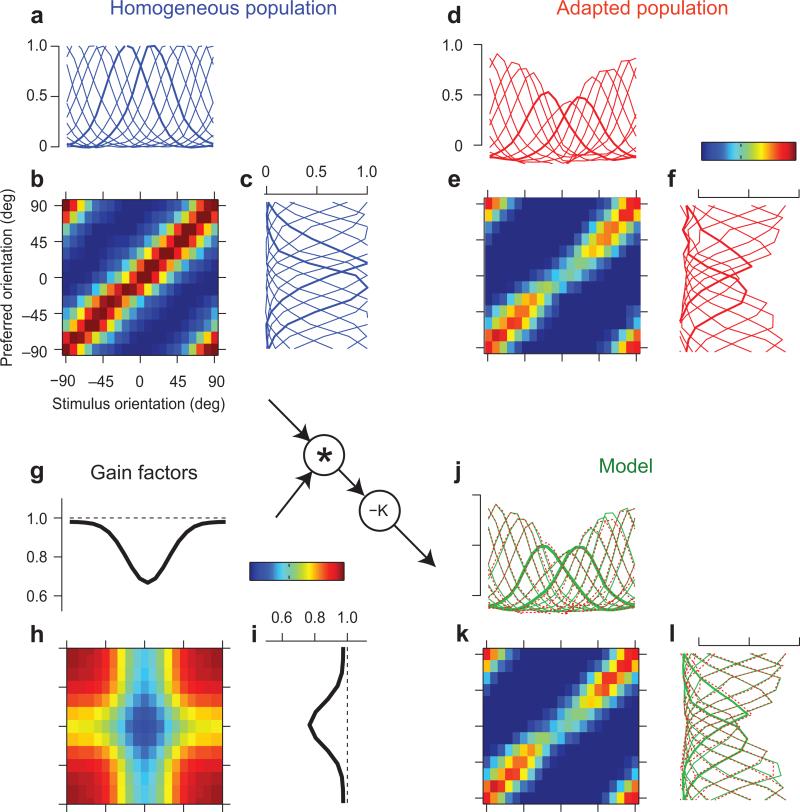
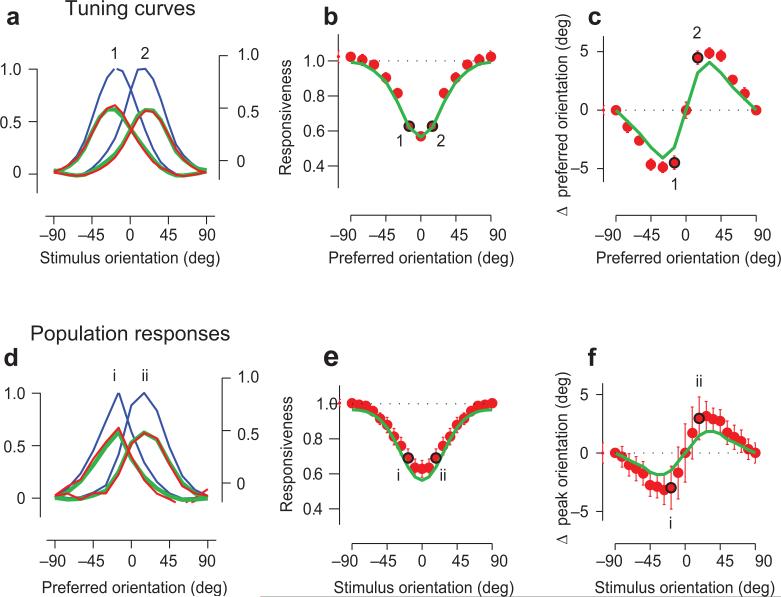
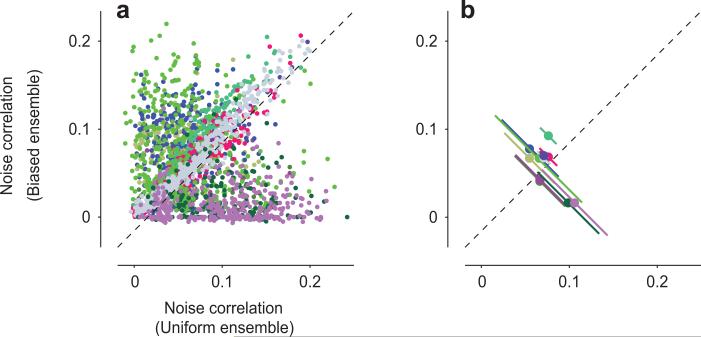
Sensory systems exhibit mechanisms of neural adaptation, which adjust neuronal activity on the basis of recent stimulus history. In primary visual cortex (V1) in particular, adaptation controls the responsiveness of individual neurons and shifts their visual selectivity. What benefits does adaptation confer on a neuronal population? We measured adaptation in the responses of populations of cat V1 neurons to stimulus ensembles with markedly different statistics of stimulus orientation. We found that adaptation served two homeostatic goals. First, it maintained equality in the time-averaged responses across the population. Second, it maintained independence in selectivity across the population. Adaptation scaled and distorted population activity according to a simple multiplicative rule that depended on neuronal orientation preference and on stimulus orientation. We conclude that adaptation in V1 acts as a mechanism of homeostasis, enforcing a tendency toward equality and independence in neural activity across the population.


Figures

Fig. 1
Fig. 1. Adaptation in visual cortex prevents biases in the population
a: Stimuli were sequences of gratings with random orientation. b: Layout of a 10×10 electrode array aligned with a map of preferred orientation (replotted from Ref. 49). c: Tuning curves of neurons grouped by preferred orientation, measured with a uniform stimulus. Responses are scaled to the values of 1 at the preferred orientation and 0 at the orthogonal orientation. d: Tuning curves measured with a biased stimulus, where the orientation of 0 deg was presented more often than the others. Thicker curves in c and d are tuning curves of neurons selective for -15 deg and +15 deg. e: A segment of the stimulus sequence in the uniform ensemble. Each dot symbolizes a grating. In the whole sequence, the probability of presentation across orientations is flat (bottom panel). f: Responses to the sequence in e. Each orientation bin is normalized to its own time average (bottom panel). g: Fitted responses using the homogeneous tuning curves. Time averages are in bottom panel, blue line. h: Simulation made using the adapted tuning curves. Time averages are in bottom panel, red line. i-j: Same as e-f, but for a biased stimulus ensemble. Responses have the same scaling factor as those in f. k: Simulation made using the homogeneous tuning curves. l: Fitted responses using the adapted tuning curves. Data in this figure are from experiments 75-6-2+3, with adaptor probability of 35%. Error bars in J-l bottom panels, ± 1 s.d.
Fig. 2
Fig. 2. Adaptation equalizes population responses
a: The time average of the population responses to uniform stimulus ensembles was normalized to 1. b: Time averages of fits by homogeneous tuning curves, averaged across 5 experiments (blue curve, shaded area ± 1 s.e.). c: Time averages of predictions by adapted tuning curves, averaged across 5 experiments (red curve). d-f: Same as a-c in responses to stimuli in biased ensembles. Data and error bars (± 1 s.e., n=4) illustrate equalization, and are repeated in each panel. The homogeneous tuning curves incorrectly predict a large peak (e), whereas the fits by the adapted tuning curves correctly capture equalization (f).
Fig. 3
Fig. 3. Adaptation decorrelates population responses
a: Correlation coefficients between pairs of neuronal bins measured with the uniform stimulus ensemble (n=5). The values on the diagonal are scaled to 1. The subsequent panels have the same scaling factors. b-c: Correlation coefficients of responses fitted by uniform tuning curves (b) and predicted by adapted tuning curves (c). d-f: Same as a-c for responses to stimuli in the biased ensemble. The homogeneous tuning curves incorrectly predict a central peak in correlation (b) whereas the fits by the adapted tuning curves correctly capture a diagonal matrix (c).
Fig. 4
Fig. 4. Neuron-specific and stimulus-specific components of adaptation
a: Tuning curves measured with uniform stimulus ensembles, averaged over all 11 sessions in 4 cats. As elsewhere, zero indicates the orientation of the adaptor. b: Matrix of responses to individual gratings, as a function of preferred orientation and stimulus orientation. c: Population response profiles in response to stimuli of different orientations. d-f: same as a-c, measured in responses to stimuli with biased statistics. g-i: A simple multiplicative model of adaptation, based on two gain factors, one dependent on stimulus orientation (g) and one dependent on neuronal preferred orientation (i). Their product is a gain matrix (h). j-l: Model fits. Format is as in d-f. The predicted response matrix (k) is, obtained by multiplying the gain matrix by the response matrix measured with the uniform ensemble (inset). Predicted tuning curves (j) and population response profiles (l) closely resemble the measured ones (replotted in red).
Fig. 5
Fig. 5. Effects of adaptation on tuning curves and population responses
a: Tuning curves of neurons selective for +15 deg and -15 deg relative to adaptor, measured with uniform stimuli (blue curves, left scale), with biased stimuli (red curves, right scale). Green curve shows model fit. b: Changes in tuning curve amplitude as a function of preferred orientation. Red dots are data, green curve is the model fit. Points marked 1 and 2 indicate the examples in a. c: Same as b, but for changes in preferred orientation. d-f: Same as a-c, but for population response profiles.
Fig. 6
Fig. 6. Adaptation to biased ensembles does not affect pairwise noise correlations
a: Noise correlations between pairs of units in response to uniform and biased ensembles. Colors distinguish data sets (n=11). For graphical purposes, only a randomly selected 5% of the 69,596 pairs are displayed. b: The same data, averaged within each data set (n = 11, each with 1,892-9,120 pairs). The error bars indicate ± 1 s.d. of the difference in noise correlations in responses to the uniform and biased ensembles.

Comment in

References

    1. Anstis S, Verstraten FA, Mather G. The motion aftereffect. Trends in cognitive sciences. 1998;2:111–117. - PubMed
    1. Gardner JL, Tokiyama SN, Lisberger SG. A population decoding framework for motion aftereffects on smooth pursuit eye movements. J Neurosci. 2004;24:9035–9048. - PMC - PubMed
    1. Gibson JJ, Radner M. Adaptation, after-effect, and contrast in the perception of tilted lines: I. Quantitative studies. Journal of Experimental Psychology. 1937;20:453–467.
    1. Jin DZ, Dragoi V, Sur M, Seung HS. Tilt aftereffect and adaptation-induced changes in orientation tuning in visual cortex. J Neurophysiol. 2005;94:4038–4050. - PubMed
    1. Wark B, Lundstrom BN, Fairhall A. Sensory adaptation. Curr Opin Neurobiol. 2007;17:423–429. doi:10.1016/j.conb.2007.07.001. - PMC - PubMed

Publication types