. 2013 Jun;14(6):564-73.
doi: 10.1038/ni.2584. Epub 2013 Apr 21.

Cutaneous immunosurveillance and regulation of inflammation by group 2 innate lymphoid cells

Affiliations

Cutaneous immunosurveillance and regulation of inflammation by group 2 innate lymphoid cells

Ben Roediger et al. Nat Immunol. 2013 Jun.

Abstract

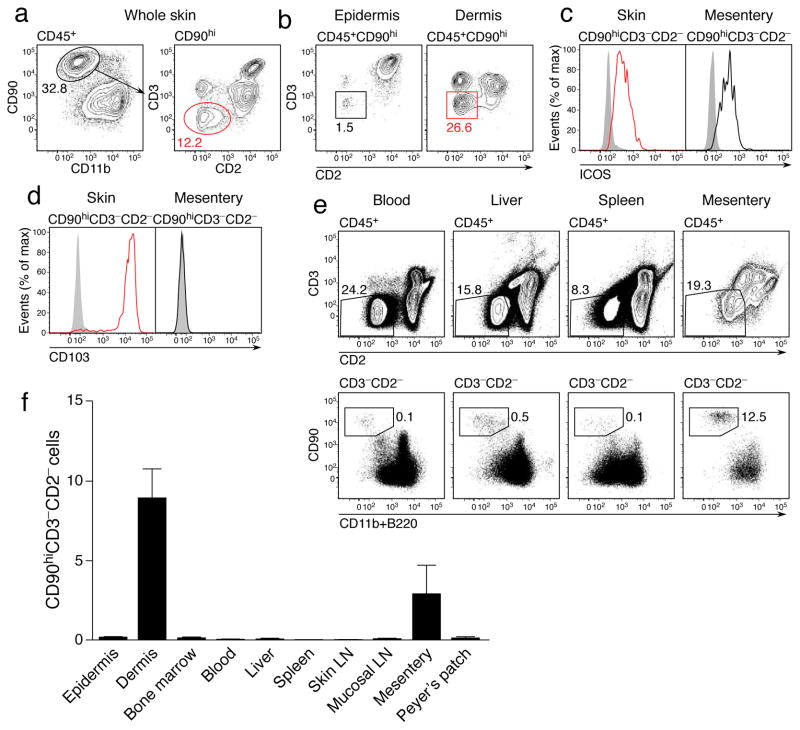
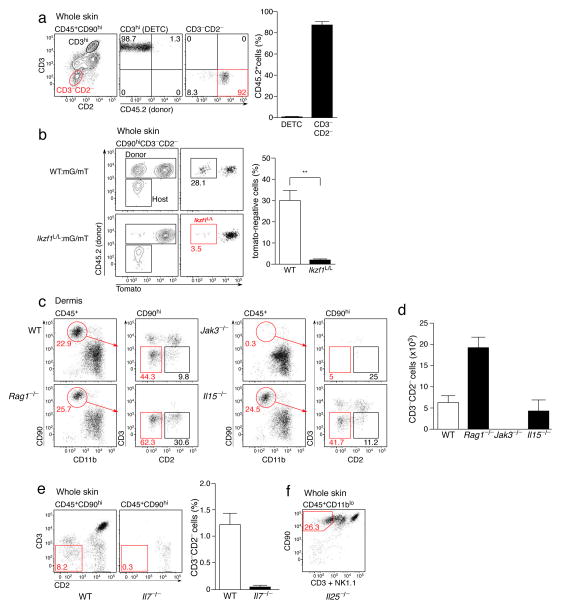
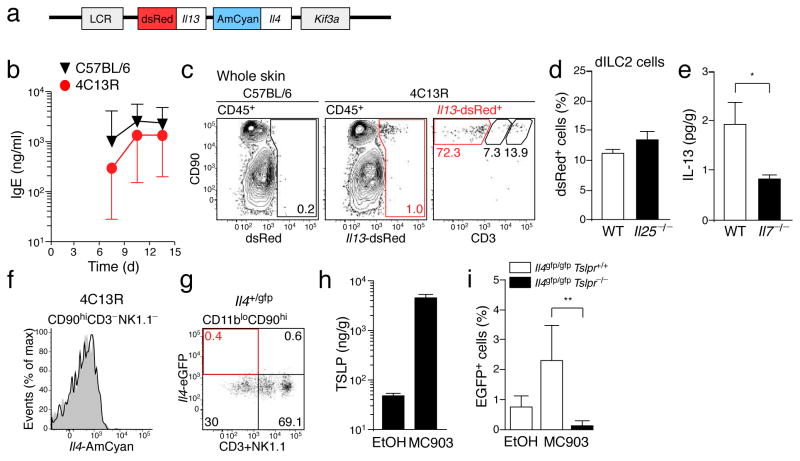
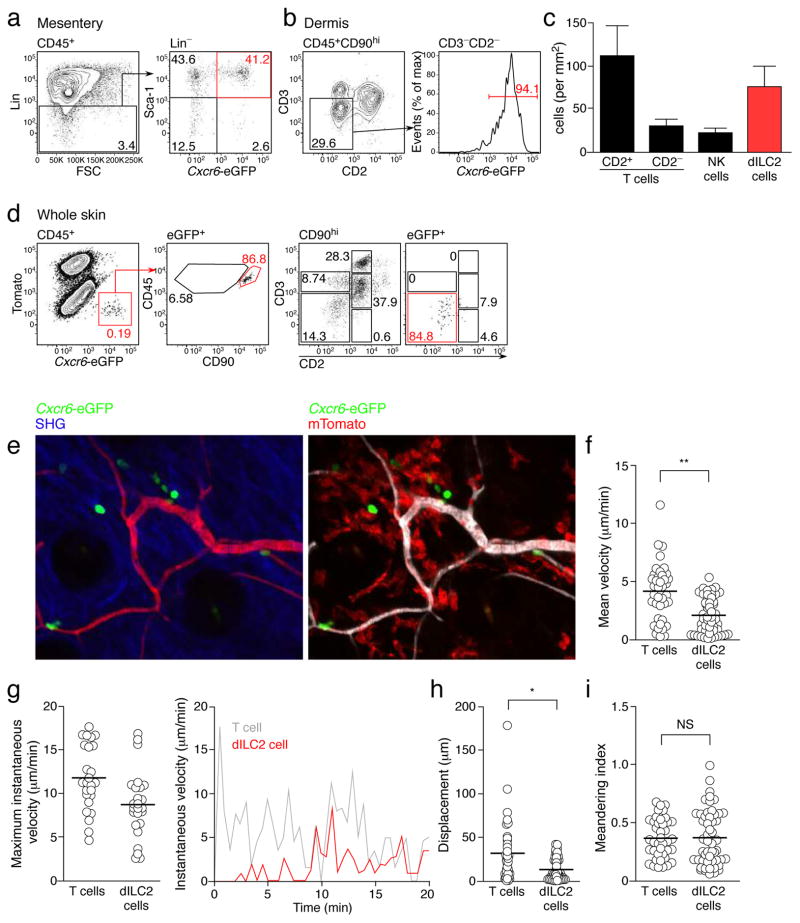
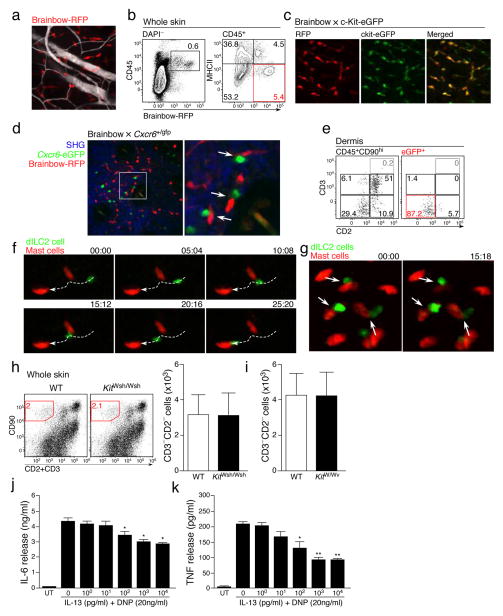
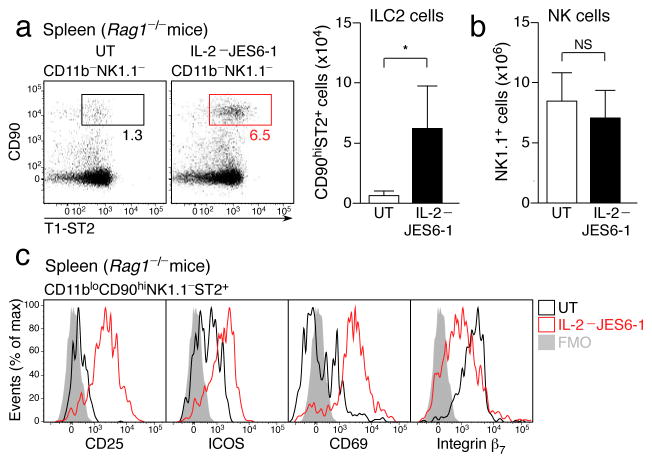
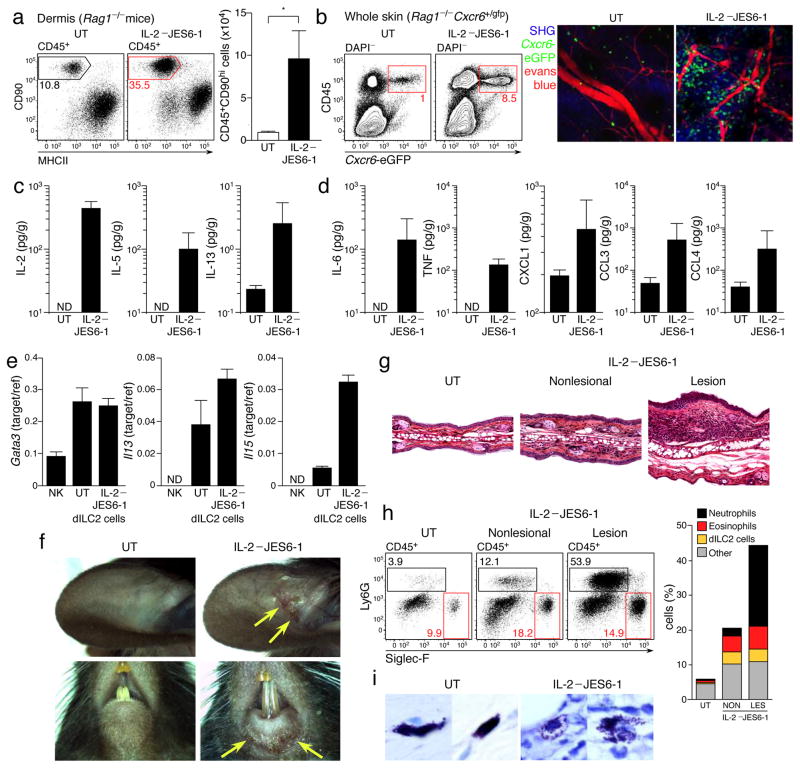
Type 2 immunity is critical for defense against cutaneous infections but also underlies the development of allergic skin diseases. We report the identification in normal mouse dermis of an abundant, phenotypically unique group 2 innate lymphoid cell (ILC2) subset that depended on interleukin 7 (IL-7) and constitutively produced IL-13. Intravital multiphoton microscopy showed that dermal ILC2 cells specifically interacted with mast cells, whose function was suppressed by IL-13. Treatment of mice deficient in recombination-activating gene 1 (Rag1(-/-)) with IL-2 resulted in the population expansion of activated, IL-5-producing dermal ILC2 cells, which led to spontaneous dermatitis characterized by eosinophil infiltrates and activated mast cells. Our data show that ILC2 cells have both pro- and anti-inflammatory properties and identify a previously unknown interactive pathway between two innate populations of cells of the immune system linked to type 2 immunity and allergic diseases.


Figures

Figure 1
Figure 1. Identification and phenotype of dermal ILC2
(a) Representative contour plots of CD45+ CD11blo CD90hi CD3 CD2 ILC2 within the skin of wild-type mice. Numbers indicate percent positive cells within each gate. Results representative of over 20 independent experiments. (b) Representative contour plots of ILC2 within the epidermis (left) and dermis (right) of wild-type mice. (c) Representative histograms depicting ICOS expression by ILC2 from the skin (left) and mesentery (right). (d) Representative histograms depicting CD103 expression by ILC2 from the skin (left) and mesentery (right). Results in (c) and (d) are representative of 2 independent experiments (n = 4). (e) Representative dotplots of CD45+ CD3 CD2 CD90hi CD11blo B220 ILC within the blood, liver, spleen and mesentery. (f) Relative abundance of ILC in indicated organs as a percentage of total isolated leukocytes. Data are mean ± s.d. and are pooled from 2 independent experiments (n = 3). LN, lymph node.
Figure 2
Figure 2. Development and homeostatic requirements of dILC2
(a) Representative dotplots (left) of mouse skin from CD45.1+ mice 8 weeks post-irradiation and transfer of bone marrow from CD45.2+ mice. Right: Percentages of DETC and dILC2 that were of donor-origin. Data are mean ± s.d. and are pooled from 2 independent experiments (n = 7). (b) Representative dotplots and graph depicting the relative contribution of donor (CD45.2+) cells to dILC2 in 50:50 wild-type mG/mT(mTomato+):wild-type (CD45.2+) (top panels, open bar) and 50:50 wild-type mG/mT(mTomato+):Ikzf1L/L (CD45.2+) (bottom panels, filled bar) mixed bone marrow chimeras 8 weeks after bone marrow transfer into wild-type (CD45.1+) hosts. Data are mean ± s.d. and are representative of two independent experiments (n = 3 for control chimeras, n = 2 for wild-type:Ikzf1L/L chimeras). (c) Representative dotplots of CD45+ CD90hi cells in the dermis of wild-type, Rag1−/−, Jak3−/− and Il15−/− mice. Red boxes indicate CD3CD2 dILC2. (d) Absolute numbers of dILC2 in the dermis of indicated mouse strains. Cell counts obtained from two ears. Data are mean ± s.d. and are representative of two independent experiments (n = 3). (e) Representative dotplots (left) and frequency (right) of dILC2 in wild-type and Il7−/− skin. Data are mean ± s.d. (n = 3). (f) Representative dotplot of CD45+ CD11blo cells in the skin of Il25−/− mice. Red gate indicates CD90hi CD3 NK1.1 dILC2.
Figure 3
Figure 3. IL-13 production by dILC2 during the steady-state
(a) Schematic of the BAC-clone used to generate the dual reporter transgenic (4C13R) mice that express AmCyan under Il4 regulatory elements and dsRed under Il13 regulatory elements. LCR, Th2 locus control region; Kif3a, kinesin-related protein 3. (b) Serum IgE titers over the course of a Nippostrongylus brasiliensis infection in wild-type (black) and 4C13R transgenic (red) mice. IgE was not detected in uninfected mice (not shown). Data are geometric mean ± 95% CI (n = 3). (c) Representative dotplots of CD45+ cells in the skin of wild-type (left) and 4C13R (middle) mice. Right: Phenotype of Il13-dsRed+ cells in 4C13R skin. Red gate indicates CD90hi CD3 NK1.1 dILC2. (d) Percentage of dILC2 that expressed Il13-dsRed in wild-type and Il25−/− 4C13R mice. (e) IL-13 protein in adult skin homogenates of wild-type (open bar) and Il7−/− (filled bar) mice, as detected by cytokine bead array. Data are mean ± s.d. (n = 8 for wild-type, n = 6 for Il7−/−). *P = 0.0337 (one-tailed unpaired t-test). (f) Representative histogram of Il4-AmCyan expression by dILC2 in 4C13R mice (black line) compared to non-transgenic control (grey histogram). Data are representative of over 10 independent experiments. (g) Representative dotplot depicting eGFP expression by CD45+ CD11blo CD90hi cells in the skin of Il4+/gfp knockin mice. Gates were set using a non-transgenic control. Data are representative of 2 independent experiments. (h) TLSP protein in skin homogenates of MC903-treated mice and vehicle (ethanol, EtOH) treated controls, as detected by ELISA. Data are mean ± s.d. (n = 5 for MC903, n = 4 for EtOH). (i) Percentage of Il4-eGFP+ dILC2 in Il4gfp/gfp (open bars) and Il4gfp/gfp Tslpr−/− (filled bar) mice topically treated with MC903. Data are mean ± s.d. (Il4gfp/gfp EtOH and MC903, n = 4; Il4gfp/gfp Tslpr−/− MC903, n = 5). **P = 0.0047 (unpaired t test).
Figure 4
Figure 4. Visualization of dILC2 in vivo
(a) Representative dotplots depicting the identification of Lin Sca-1+ natural helper cells from the mesentery of Cxcr6+/gfp mice. (b) Left: Representative contour plots of CD45+ CD90hi cells in the skin of Cxcr6+/gfp mice. Gate indicates CD2 CD3 dILC2. Right: Histogram showing eGFP expression by dILC2. Data are representative of over 10 independent experiments. (c) Density of indicated cell subsets within the ear of Cxcr6+/gfp mice. Counting was performed using multiphoton microscopy and flow cytometry (see Supplementary Methods). Data are mean ± s.d. and are representative of 2 independent experiments. (d) Representative dotplots of CD45+ (left) and eGFP+ cells (second left and far right panels) from the skin of albino C57BL/6 mice 8 weeks after irradiation and co-transfer of bone marrow from Rag1−/− Cxcr6+/gfp and RAG-1-sufficient mG/mT(mTomato+) mice. Gates applied to eGFP+ cells were determined on total CD45+ population. (e) Representative images of mixed chimeric mouse skin by intravital multiphoton microscopy. Each image is a z-projection through a volume of 28 μm within the dermis. Extracellular matrix in the dermis was detected by second harmonic generation (SHG) signals (blue). Blood vessels were visualized using Evans blue. dILC2 shown in green. (f) Mean velocity of T cells and dILC2. (g) Left: Maximum instantaneous velocity of T cells and dILC2 measured during the imaging period. Right: Representative graph of instantaneous velocity of a single T cell (grey line) and a single ILC2 (red line) over 20 min. (h) Displacement of T cells and dILC2 over 15 minutes. (i) Meandering index of T cells and dILC2. Data in (f), (g), (h) and (i) are pooled from 4 independent experiments (T cells, n = 39; dILC2, n = 51). Symbols represent individual cells. *P < 0.001 and **P < 0.0001 (unpaired t-test). NS, not significant.
Figure 5
Figure 5. dILC2 interaction with skin-resident mast cells
(a) Representative image of the Brainbow dermis by intravital multiphoton microscopy. Blood vessels were visualized using Evans blue (white). Image is a z-projection through a dermal volume of 60μm. (b) Representative flow cytometry plots of total skin cells (left) and CD45+ cells (right) from a Brainbow mouse. Red gate indicates RFPhi MHC-IIlo cells. Data are representative of 3 independent experiments. (c) Representative images of the dermis from Brainbow × c-Kit-eGFP mice. RFP+ cells, red. eGFP+ mast cells, green. Double-positive cells, yellow. (d) Representative image of Brainbow × Cxcr6+/gfp skin by intravital multiphoton microscopy. Extracellular matrix in the dermis was detected by SHG signals (blue). Cxcr6-eGFP+ cells shown in green. RFP+ cells are red. Arrows indicate RFPhi mast cells in close proximity with eGFP+ cells. (e) Representative dotplots of CD45+CD90hi (left) and eGFP+ cells (right) from the skin of an albino Brainbow mice 8 weeks after irradiation and co-transfer of bone marrow from Rag1−/− Cxcr6+/gfp and RAG-1-sufficient non-fluorescent mice. Gates for eGFP+ cells in right panel were determined on the total CD45+CD90hi population (left). (f) Representative time-lapse images of migratory dILC2 (green) in chimeric mouse skin by intravital multiphoton microscopy. Red, mast cells. White line, track of ILC2 migration during the observation period. Time shown in mm:ss. (g) Representative time-lapse images of chimeric mouse skin by intravital multiphoton microscopy. Arrows indicate dILC2 (green) that formed extended interactions with mast cells (red) throughout the observation period. Time shown in mm:ss. (h) Representative dotplots (left) and absolute number (right) of CD90hi CD3 CD2 dILC2 in wild-type and B6-KitW-sh/W-sh ears. (i) Absolute number dILC2 in wild-type and WBB6F1-KitW/W-v ears. Data in (i) and (j) are mean ± s.d. (n = 3). (j and k) Effect of exogenous IL-13 on cytokine production by mast cells in vitro. Mast cells were pre-incubated with mrIL-13 (0–10,000 pg/ml), sensitized with anti-DNP IgE (2 μg/ml) for 16 h, washed then stimulated with DNP-HSA (20 ng/ml) in the presence of rmIL-13 (0 – 10000 pg/ml) for 6 h. (j) IL-6 and (k) TNF in supernatant were measured by ELISA. Data in (k) and (l) are expressed as mean ± s.e.m. for 3 independent experiments. Significant differences between cytokine release by DNP alone and in the presence of IL-13 were determined by one way ANOVA with Dunnett’s post-test. * P < 0.01, **P < 0.001.
Figure 6
Figure 6. IL-2 induced activation and proliferation of ILC2 in vivo.
(a) Left: Representative dotplots of CD11b NK1.1 splenocytes from IL-2–JES6-1 treated Rag1−/− mice and untreated controls. Boxes indicate percentage of CD90hi ST2+ ILC2. Right: Absolute number of splenic ILC2 from IL-2–JES6-1 treated mice compared to untreated controls. (b) Absolute number of splenic NK1.1+ NK cells in IL-2–JES6-1 treated Rag1−/− mice and untreated controls. (c) Representative histograms depicting surface marker expression by splenic ILC2 from untreated (black) and IL-2–JES6-1 treated (red) Rag1−/− mice. FMO, “fluorescence minus one” control. Data in (a) and (b) are mean ± s.d. and are representative of three independent experiments (untreated, n = 4; IL-2–JES6-1, n = 5). *P = 0.0180 (unpaired t-test). NS, not significant.
Figure 7
Figure 7. IL-2 stimulation of dILC2 in vivo.
(a) Left: Representative dotplots of dermal leukocytes isolated from IL-2–/JES6-1 treated Rag1−/− mouse ears and untreated controls. Gates indicate percentage of CD90hi dILC2. Right: Absolute number of CD45+CD90hi dILC2 from IL-2–JES6-1 treated mice compared to untreated controls. Data are mean ± s.d. and are representative of two independent experiments (untreated, n = 4; IL-2/JES6-1, n = 5). *P = 0.0015 (unpaired t-test). (b) Left: Representative dotplots of skin cells isolated from IL-2–JES6-1 treated Rag1−/− Cxcr6+/gfp mice and untreated controls. Gates indicate percentage of eGFP+ dILC2. Right: Representative images of IL-2–JES6-1 treated and untreated Rag1−/− Cxcr6+/gfp mouse skin by intravital multiphoton microscopy. Each image is a z-projection through a volume of 88 μm within the dermis. Extracellular matrix in the dermis was detected by SHG signals (blue). Blood vessels were visualized using Evans blue (red). dILC2 shown in green. (c and d) Cytokine concentrations in adult tail skin homogenates of IL-2–JES6-1 treated Rag1−/− mice and untreated controls, as detected by cytokine bead array. Data are geometric mean ± 95% CI and are pooled from three independent experiments (untreated, n = 9; IL-2/JES6-1, n = 12). (e) Gata3, Il13 and Il5 mRNA expression by sorted dILC2 from untreated and IL-2–JES6-1 treated Rag1−/− mice, as measured by real-time PCR. Splenic NK cells were included for comparison. (f) Representative macroscopic images of spontaneous skin lesions (yellow arrows) observed in mice treated with IL-2–JES6-1. (g) Ear sections obtained from untreated and IL-2-treated Rag1−/− mice, stained with hematoxylin and eosin. (h) Left: Representative flow cytometry dotplots of leukocytes isolated from lesional and non-lesional skin of IL-2-treated Rag1−/− mice. Boxes indicate Ly6G+ neutrophils (black) and Siglec-F+ eosinophils (red). Right: Proportion of neutrophils, eosinophils and dILC2 in lesional and non-lesional skin of IL-2-treated Rag1−/− mice compared to an untreated control. (i) Representative tail sections obtained from untreated and IL-2-treated Rag1−/− mice, stained with toluidine blue.

Comment in

References

    1. Bieber T. Atopic dermatitis. N Engl J Med. 2008;358:1483–1494. - PubMed
    1. Li M, et al. Induction of thymic stromal lymphopoietin expression in keratinocytes is necessary for generating an atopic dermatitis upon application of the active vitamin D3 analogue MC903 on mouse skin. The Journal of investigative dermatology. 2009;129:498–502. - PubMed
    1. Spits H, et al. Innate lymphoid cells - a proposal for uniform nomenclature. Nature reviews Immunology. 2013;13:145–149. - PubMed
    1. Chang YJ, et al. Innate lymphoid cells mediate influenza-induced airway hyper-reactivity independently of adaptive immunity. Nature immunology. 2011;12:631–638. - PMC - PubMed
    1. Mjosberg JM, et al. Human IL-25- and IL-33-responsive type 2 innate lymphoid cells are defined by expression of CRTH2 and CD161. Nature immunology. 2011;12:1055–1062. - PubMed

Publication types

MeSH terms