Comparative Study
. 2013 May;19(5):635-9.
doi: 10.1038/nm.3112. Epub 2013 Apr 21.

Anatomical localization, gene expression profiling and functional characterization of adult human neck brown fat

Affiliations
Comparative Study

Anatomical localization, gene expression profiling and functional characterization of adult human neck brown fat

Aaron M Cypess et al. Nat Med. 2013 May.

Abstract

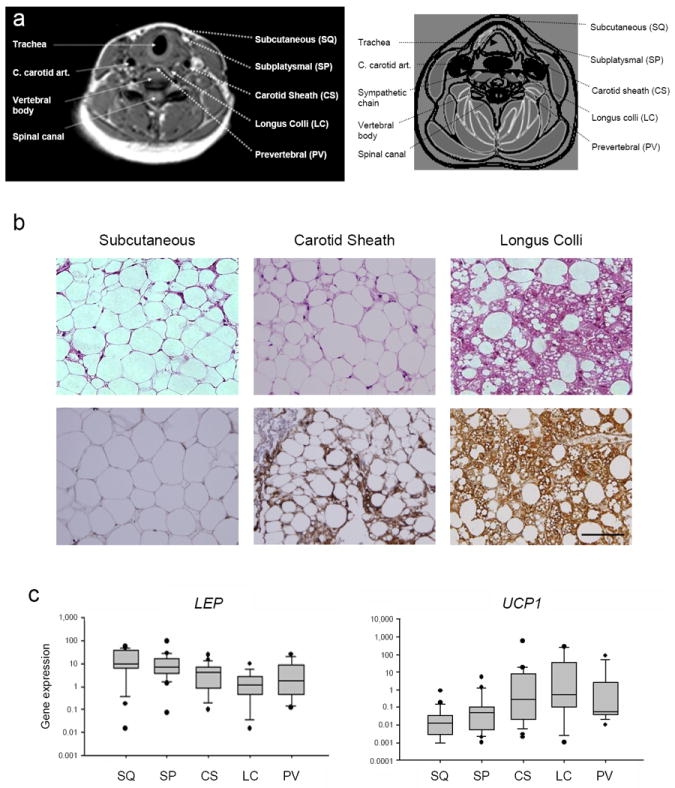
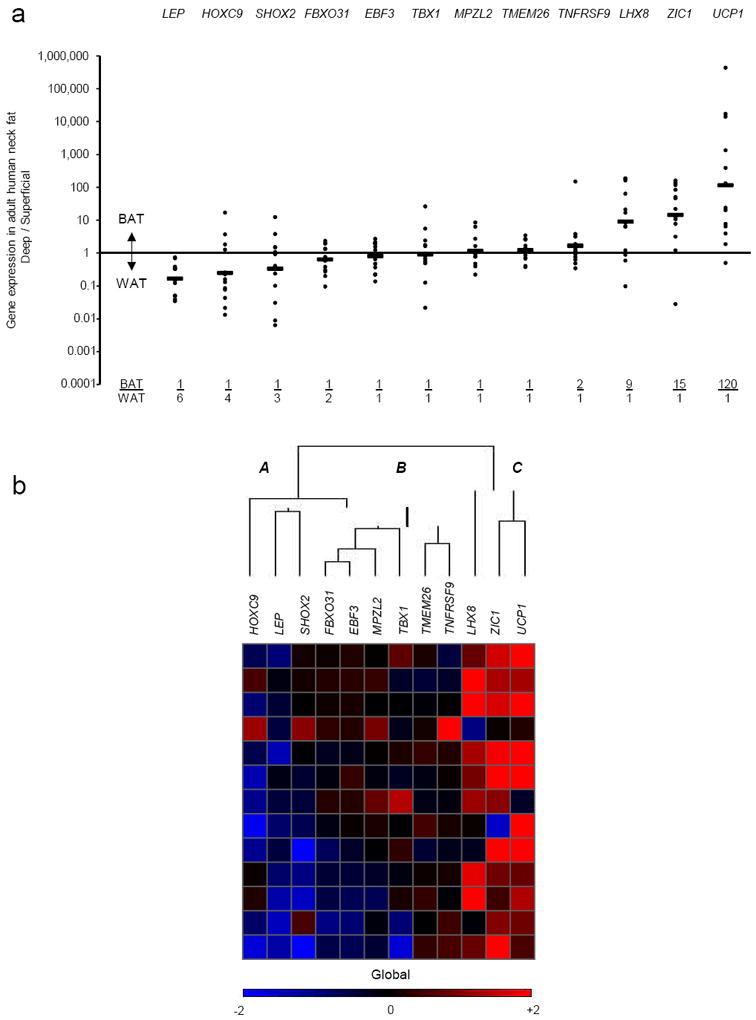
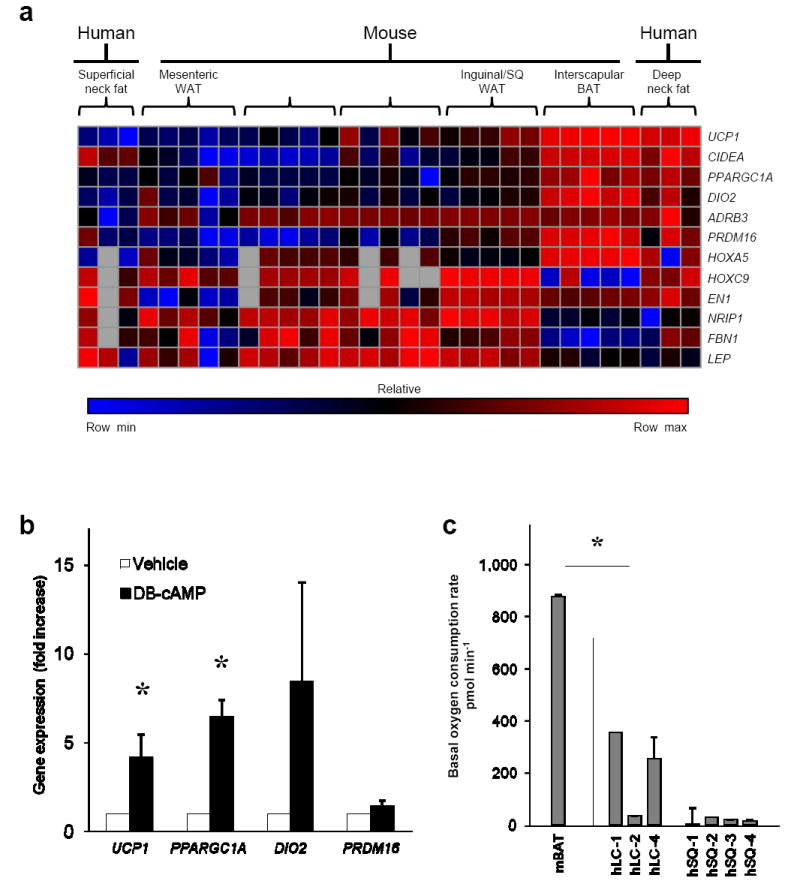
The imbalance between energy intake and expenditure is the underlying cause of the current obesity and diabetes pandemics. Central to these pathologies is the fat depot: white adipose tissue (WAT) stores excess calories, and brown adipose tissue (BAT) consumes fuel for thermogenesis using tissue-specific uncoupling protein 1 (UCP1). BAT was once thought to have a functional role in rodents and human infants only, but it has been recently shown that in response to mild cold exposure, adult human BAT consumes more glucose per gram than any other tissue. In addition to this nonshivering thermogenesis, human BAT may also combat weight gain by becoming more active in the setting of increased whole-body energy intake. This phenomenon of BAT-mediated diet-induced thermogenesis has been observed in rodents and suggests that activation of human BAT could be used as a safe treatment for obesity and metabolic dysregulation. In this study, we isolated anatomically defined neck fat from adult human volunteers and compared its gene expression, differentiation capacity and basal oxygen consumption to different mouse adipose depots. Although the properties of human neck fat vary substantially between individuals, some human samples share many similarities with classical, also called constitutive, rodent BAT.


Figures

Figure 1
Figure 1. Anatomical localization of adult human neck BAT
(a) The five different sites from which adipose tissue was resected are shown. On the left side are standard anatomical landmarks in italics: trachea, common carotid artery (C. carotid art.), sympathetic chain, vertebral body, and spinal canal. On the right side are the fat depots. The superficial depots comprise the subcutaneous (SQ) and subplatysmal (SP) regions and deep depots comprise the carotid sheath (CS), longus colli (LC), and prevertebral (PV) regions. The left side shows the axial cross-sectional MRI image of a healthy volunteer at the level of the fifth cervical vertebra (“C5”). Dashed white arrows point to the location of the landmarks and adipose tissue depots. The right side is a schematic diagram of the MRI image. Skeletal muscle is gray; air in the trachea is white; blood vessels are black; fascial planes are separated by black lines; and landmarks are identified using dashed black arrows. (b) Human neck fat from the subcutaneous (left), carotid sheath (center), and longus colli (right) depots from a representative volunteer was stained with hematoxylin and eosin (upper panels) or immunohistochemically for UCP1 (lower panels). Scale bar, 100 μm. (c) From 18 individuals undergoing routine neck surgery, gene expression levels of WAT-associated LEP and BAT-associated UCP1 are plotted on a logarithmic scale. The gray boxes enclose the 25th and 75th percentiles, and the internal line is the median. The whiskers are the 10th and 90th percentiles, and the black circles are outliers. Non-parametric ANOVA for both genes had a P = 0.002.
Figure 2
Figure 2. Adult human neck BAT lineage tracing
(a) Shown for 13 individuals undergoing routine neck surgery is the ratio of the gene expression found in the deep tissue expressing the highest level of UCP1 (“BAT”) vs. that found in each individual’s SQ fat (“WAT”) for each of the 12 lineage markers. Each closed circle represents a single person. The geometric mean for each gene is represented by the horizontal bars and is also shown at the bottom of the graph as the BAT/ WAT ratio. (b) For the cluster analysis, each color in the figure represents the log10 ratio of the (BAT gene expression) / (WAT gene expression) of a particular gene in each volunteer. Each column contains data from a specific gene, and each row contains data from a single person. Red squares represent high ratios and blue squares represent low ratios. The values in the heat map range between −2 and +2 (i.e. expression ratios between 100-fold in one direction to 100-fold in the other). For visualization purposes, values outside of that range are replaced by either −2 or +2, as appropriate. The dendrogram reflects the degree of correlation of the genes assessed by the hierarchical clustering. Letters “A,”, “B,” and “C” represent the groupings of markers that were, respectively, down-regulated in deeper depots (SHOX2, LEP, HOXC9); not changed (TNFRSF9, TMEM26, TBX1, MPZL2, EBF3, FBXO31); and up-regulated (UCP1, ZIC1, LHX8).
Figure 3
Figure 3. Adult human neck BAT expresses functional genes similar to mouse interscapular BAT, can be grown ex vivo from multiple adipose tissue depots, and has an unstimulated energy expenditure similar to that of mouse interscapular BAT
(a) Gene expression of BAT- and WAT-associated genes was measured in five different mouse adipose tissue depots taken from five C57Bl/6 male mice, 12 weeks-old. Clustering of the genes from the mouse depots was done with the samples of human deep neck fat that had the highest expression of UCP1, along with their associated subcutaneous fat. The heat map represents the relative abundance of each gene across all 31 samples. The values were normalized within each row using a linear color scale. The highest value in each row is colored bright red; the lowest is colored bright blue; those near the midpoint between these values are colored black. Missing values are colored gray. (b) Preadipocytes from the stromal vascular fraction of both superficial and deep neck adipose tissue fat depots from four individuals (eight different sites in total), were differentiated into mature adipocytes and then treated for 4 hours with 500 μM dibutyryl-cAMP (DB-cAMP) or vehicle. Shown is the fold increase in expression of four different BAT-associated genes, UCP1, PPARGC1A, DIO2, and PRDM16, compared to treatment with vehicle for the same duration. *, P < 0.05; errors bars are s.e.m. (c) Adipose tissue from mouse interscapular BAT or human cervical adipose tissue from four individuals’ subcutaneous (SQ) and longus colli (LC) depots. Labeling is as follows: “m” or “h” for mouse and human, respectively; neck fat depot; and number referring to the particular individual. *, P < 0.05; errors bars are s.e.m.

Comment in

References

Reference List

    1. Cannon B, Nedergaard J. Brown adipose tissue: function and physiological significance. Physiol Rev. 2004;84:277–359. - PubMed
    1. Richard D, Picard F. Brown fat biology and thermogenesis. Front Biosci. 2011;16:1233–1260. - PubMed
    1. Orava J, et al. Different metabolic responses of human brown adipose tissue to activation by cold and insulin. Cell Metab. 2011;14:272–279. - PubMed
    1. Wijers SL, Saris WH, Marken Lichtenbelt WD. Individual thermogenic responses to mild cold and overfeeding are closely related. J Clin Endocrinol Metab. 2007;92:4299–4305. - PubMed
    1. van Marken Lichtenbelt WD, et al. Cold-activated brown adipose tissue in healthy men. N Engl J Med. 2009;360:1500–1508. - PubMed

For the Online Methods

    1. Tseng YH, et al. New role of bone morphogenetic protein 7 in brown adipogenesis and energy expenditure. Nature. 2008;454:1000–1004. - PMC - PubMed
    1. Pisania A, et al. Quantitative analysis of cell composition and purity of human pancreatic islet preparations. Lab Invest. 2010;90:1661–1675. - PMC - PubMed
    1. Reich M, et al. GenePattern 2.0. Nat Genet. 2006;38:500–501. - PubMed
    1. Tchkonia T, et al. Fat depot-specific characteristics are retained in strains derived from single human preadipocytes. Diabetes. 2006;55:2571–2578. - PubMed
    1. Steenhuis R, Pettway GJ, Ignelzi MA. Cell surface expression of stem cell antigen-1 (Sca-1) distinguishes osteo-, chondro-, and adipoprogenitors in fetal mouse calvaria. Calcif Tissue Int. 2008;82:44–56. - PubMed

Publication types

MeSH terms