. 2013 Apr 19:2013:bat015.
doi: 10.1093/database/bat015. Print 2013.

PhenoMiner: quantitative phenotype curation at the rat genome database

Affiliations

PhenoMiner: quantitative phenotype curation at the rat genome database

Stanley J F Laulederkind et al. Database (Oxford). .

Abstract

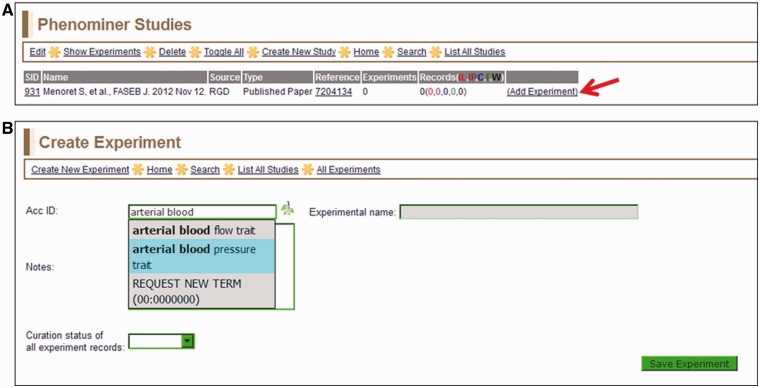
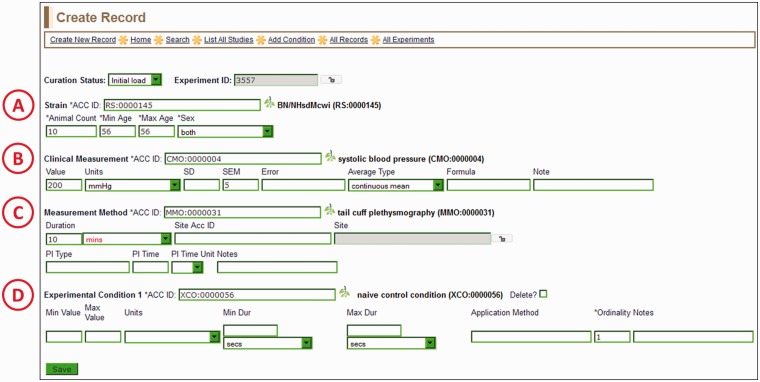
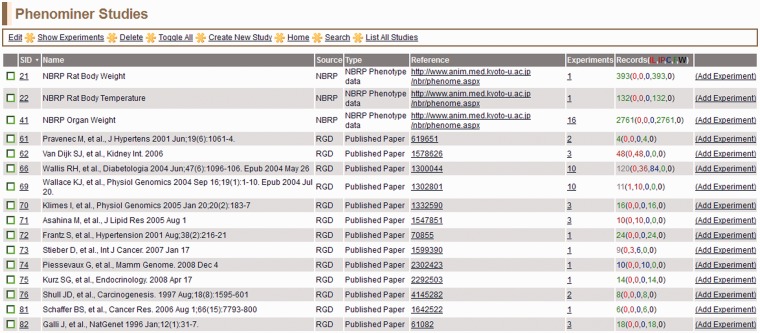
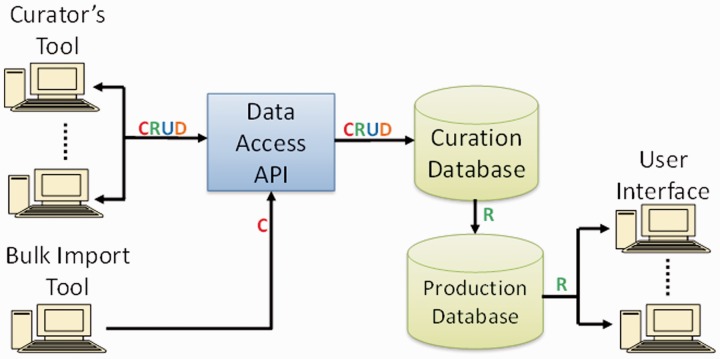
The Rat Genome Database (RGD) is the premier repository of rat genomic and genetic data and currently houses >40 000 rat gene records as well as human and mouse orthologs, >2000 rat and 1900 human quantitative trait loci (QTLs) records and >2900 rat strain records. Biological information curated for these data objects includes disease associations, phenotypes, pathways, molecular functions, biological processes and cellular components. Recently, a project was initiated at RGD to incorporate quantitative phenotype data for rat strains, in addition to the currently existing qualitative phenotype data for rat strains, QTLs and genes. A specialized curation tool was designed to generate manual annotations with up to six different ontologies/vocabularies used simultaneously to describe a single experimental value from the literature. Concurrently, three of those ontologies needed extensive addition of new terms to move the curation forward. The curation interface development, as well as ontology development, was an ongoing process during the early stages of the PhenoMiner curation project. Database URL: http://rgd.mcw.edu.


Figures

Figure 1
Figure 1
Workflow of PhenoMiner curation. (A) The quantitative PhenoMiner curation workflow showing the sequence that establishes first, the ‘Study’, second, the experiment name (Exp) and third, all the details of the annotation ‘Record’ (Rec). (B) Workflow for the new PhenoMiner-style qualitative annotation of QTLs. This workflow uses the same ontologies as the PhenoMiner curation, but uses the general curation tool because no numerical values are entered.
Figure 2
Figure 2
(A) Selected study page—this page displays the citation, a reference link and other information about the study. Clicking the ‘Add Experiment’ link (red arrow) returns the ‘Create Experiment’ page. (B) Create Experiment page—this page features an autocompleting text box for entering term IDs for either vertebrate trait terms (VT) or disease terms (RDO). The text box will accept a VT or RDO ID or any key word(s) found in VT or RDO terms. If a suggested term is selected, the ID is automatically entered in the selection text box and the term itself will be automatically entered in the accompanying ‘Experimental name’ box.
Figure 3
Figure 3
View Experiments page—this page lists all experiments for the particular study being curated, in this case ‘body mass’ (EID 3558) and ‘arterial blood pressure trait’ (EID 3557) for SID:851 (listed on left side of page).
Figure 4
Figure 4
Create Record Page—most of the information for a manual PhenoMiner annotation is entered here. Four ontology/vocabulary terms are required and many more optional fields allow the addition of basic experimental information. In this example, the rat strain (A) is BN/NHsdMcwi, the CMO term (B) is ‘systolic blood pressure’, the MMO term (C) is ‘tail cuff plethysmography’ and the XCO term (D) is ‘naïve control condition’. The optional MA term goes in the ‘Site ACC ID’ text box in the measurement method section (C).
Figure 5
Figure 5
View Records page—a typical annotation viewed in the PhenoMiner curation tool with all data visible on one line.
Figure 6
Figure 6
PhenoMiner Studies page—this is a one-page view of all studies in the PhenoMiner curation tool. The columns are all sortable by clicking on the headings. Important to note is the ‘Records’ column, which shows the number of records and status of those records. The status is color-coded—IL (red): initial load; IP (dark red): in progress; C (blue): curated; F (green): final; W (black): withdrawn.
Figure 7
Figure 7
PhenoMiner software components and data flow. Operations in data flow: C = create, R = read, U = update, D = delete (API = application programming interface).

References

    1. Hubner N. Expressing physiology. Nat. Genet. 2006;38:140–141. - PubMed
    1. Dwinell MR. Online tools for understanding rat physiology. Brief Bioinform. 2010;11:431–439. - PMC - PubMed
    1. Kwitek AE, Jacob HJ, Baker JE, et al. BN phenome: detailed characterization of the cardiovascular, renal, and pulmonary systems of the sequenced rat. Physiol. Genomics. 2006;25:303–313. - PubMed
    1. Serikawa T, Mashimo T, Takizawa A, et al. National BioResource Project-Rat and related activities. Exp. Anim. 2009;58:333–341. - PubMed
    1. Smith CL, Goldsmith CA, Eppig JT. The Mammalian Phenotype Ontology as a tool for annotating, analyzing and comparing phenotypic information. Genome Biol. 2005;6:R7. - PMC - PubMed

Publication types

LinkOut - more resources