. 2013 Jun;10(6):577-83.
doi: 10.1038/nmeth.2445. Epub 2013 Apr 21.

Gene-pair expression signatures reveal lineage control

Affiliations

Gene-pair expression signatures reveal lineage control

Merja Heinäniemi et al. Nat Methods. 2013 Jun.

Abstract

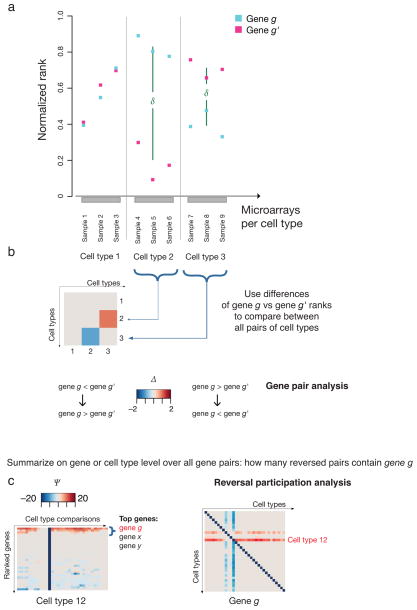
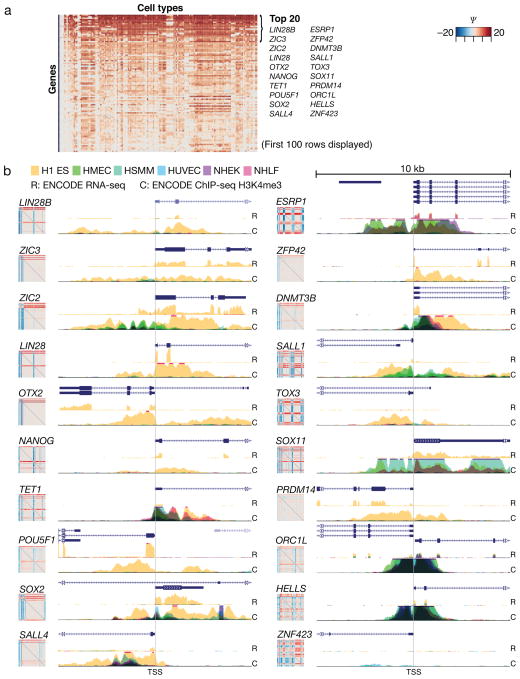
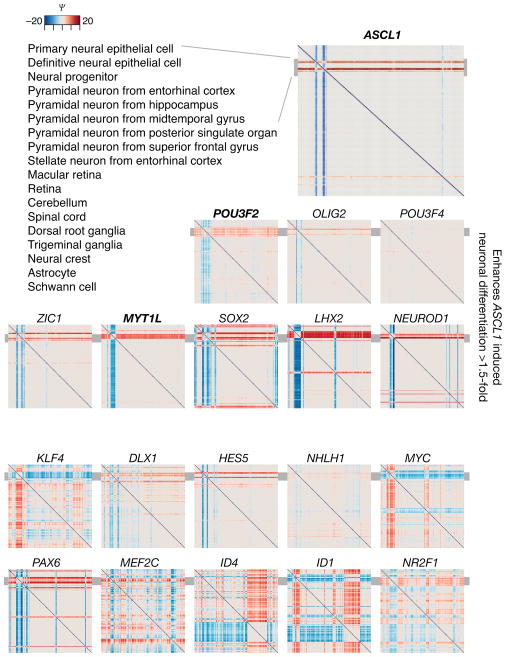
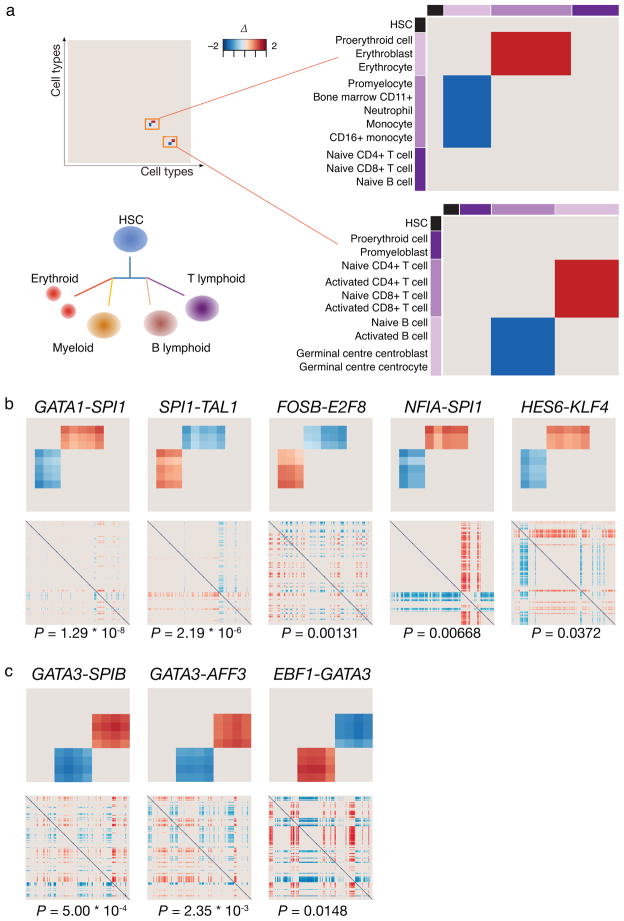
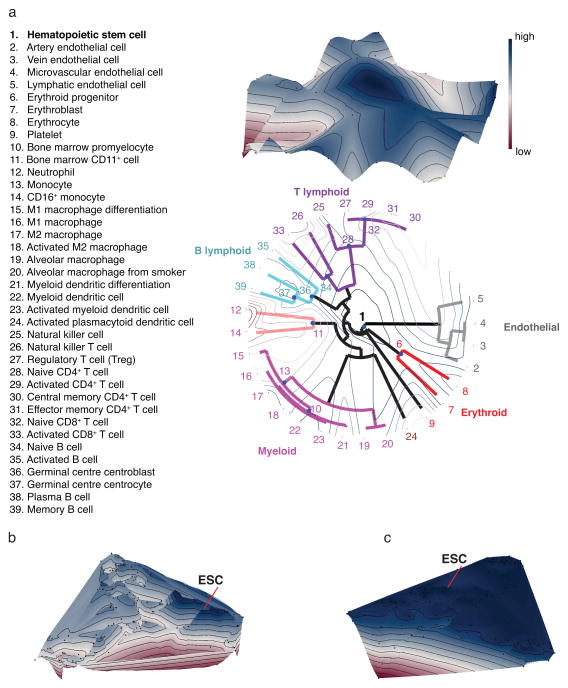
The distinct cell types of multicellular organisms arise owing to constraints imposed by gene regulatory networks on the collective change of gene expression across the genome, creating self-stabilizing expression states, or attractors. We curated human expression data comprising 166 cell types and 2,602 transcription-regulating genes and developed a data-driven method for identifying putative determinants of cell fate built around the concept of expression reversal of gene pairs, such as those participating in toggle-switch circuits. This approach allows us to organize the cell types into their ontogenic lineage relationships. Our method identifies genes in regulatory circuits that control neuronal fate, pluripotency and blood cell differentiation, and it may be useful for prioritizing candidate factors for direct conversion of cell fate.


Figures

Fig. 1
Fig. 1. Gene pair expression reversal analysis exemplified by schematic data
A schematic example to illustrate the principle of the expression reversal method is shown. (a) The ranks of two hypothetical genes g and g′ are plotted from microarray samples assigned to three hypothetical cell types. (b) Gene pair reversal plot. The reversal behavior of the {gene g, gene g′} gene pair quantified for all pair-wise comparisons of N = 3 cell types is shown as an N x N symmetric matrix. The value, indicating the extent of reversal behavior is represented by the color in the heat map. Red tones indicate that the pair configuration changes from gene ggene g′ in the first cell type of a comparison pair (“row-to-column comparison”) to gene ggene g′ in the second cell type. A reversal in the opposite direction in cell type comparisons are indicated in blue shades. (c) Reversal participation. The Ψ value for gene g quantifies its reversal participation from all gene pairs displayed across each pair-wise comparisons of (here N = 32) cell types. A specific gene pair configuration in multiple gene pairs involving g, will be reflected by a high score (dark red or blue). Alternatively, the gene reversal participation can be assessed at the cell type level by extracting from the gene portraits the cell type (row) of interest, and subsequently sorting by maximal Ψ value.
Fig. 2
Fig. 2. Cell type-level analysis of reversal participation in the ESC highlights genes used to induce pluripotency
Reversal participation analysis for ESCs compared to all other cell types reveals genes that are important in determining ESC (refer to Supplementary Table 3 for the order of cell types in columns). (a) The first 100 rows (of 2,602 TFs evaluated) of the ESC cell portrait are displayed and the names of top 20 most specific ESC-high transcription regulating genes are indicated, including those used to induce pluripotency in human cells: LIN28, NANOG, POU5F1 and SOX2. (b) Active ESC transcription and promoter state was evaluated from ENCODE RNA-seq (R) and ChIP-seq (C) of histone methylation datasets. The level of the H3K4me3 marker for active promoters around 5 kb up- or downstream from the gene transcription start site (TSS) is shown from six normal ENCODE cell types H1 ES: human ESC line H1, HMEC: breast epithelial cell, HSMM: skeletal muscle myoblast, HUVEC: umbilical vein endothelial cell, NHEK: epithelial keratinocyte, NHLF: lung fibroblast. RNA-seq data is available from H1 ES, HUVEC and NHEK cells. The high ESC expression and its specificity can be compared against the gene reversal portraits shown adjacent to the ChIP tracks.
Fig. 3
Fig. 3. Reversal participation analysis of a candidate gene set for the induction of neuronal differentiation reflects success in a functional assay
A set of 19 candidate transcription regulating genes was characterized experimentally for their neuronal differentiation induction potential. The reversal participation gene portraits of these genes are shown. The ordering of the portraits reflects the experimental success to induce neuronal fate in combination with ASCL1 that was found most potent on its own to induce the conversion of fibroblasts to neuronal cells. The grey bar indicates the location (rows) of neuronal cells in the figures.
Fig. 4
Fig. 4. Identification of reversal pairs in lineage splits of the blood system
The HSC is the common precursor of all blood cells. Lymphoid cells branch off separately to give rise to the B and T cell lineages, wheras the myelo-erythroid lineage gives rise to the later binary split between the erythroid and myeloid cells. Lineage-determining TF pairs of the binary splits are expected to follow the reversal pattern shown in the idealized gene pair reversal plots for the subset of relevant lineages used as a query criterion. An ideal pair will also show no reversals for other cell type pairs in the full 166x166 cell type comparison matrix (a). Pairs of TFs that satisfy such properties and show a statistically significant restricted reversal in the 166x166 cell type data are shown with their p-values (hypergeometric test) for the erythroid-myeloid (in (b)) and B-T lymphoid (in (c)) splits. The heat maps represent gene pair reversal plots as in Fig. 1b, color corresponds to the mean normalized rank difference.
Fig. 5
Fig. 5. Lineage relationships among hematopoietic and endothelial cell types revealed measuring similarity based on gene pair expression reversals
An evaluation of utility of the similarity Φ to reflect lineage separation is shown. (a) Hierarchical clustering of differentiated cell types with the new feature of placement of precursor cell types to three branch points using the Hungarian algorithm and mapping of the tree to a landscape is visualized. The circular dendrogram in the x-y plane arranges cells to branching lineages identified by different colors. To represent all cell types and their similarity Φ, multidimensional scaling is shown with (b) TFs or (c) metabolic genes. The landscape elevation (z-dimension) represents the Φ similarity to the ESC giving rise to a potential-like landscape in which development follows the downhill gradient as in Waddington’s epigenetic landscape. Blue color and high altitude on the landscape corresponds to large similarity to the pluripotent state.

Comment in

References

    1. Alberts B, et al. Molecular Biology of the Cell. 3E. Garland Science; New York: 1994. Cells and Genomes; p. 1408.
    1. Zhou JX, Huang S. Understanding gene circuits at cell-fate branch points for rational cell reprogramming. Trends Genet. 2010;27:55–62. - PubMed
    1. Kauffman SA. Control circuits for determination and transdetermination. Science. 1973;181:310–8. - PubMed
    1. Kauffman SA, Shymko RM, Trabert K. Control of sequential compartment formation in Drosophila. Science. 1978;199:259–70. - PubMed
    1. Zhang P, et al. Negative cross-talk between hematopoietic regulators: GATA proteins repress PU.1. Proc Natl Acad Sci US A. 1999;96:8705–10. - PMC - PubMed

Publication types