. 2013 May 1;27(9):985-90.
doi: 10.1101/gad.217778.113. Epub 2013 Apr 19.

The histone H3.3K27M mutation in pediatric glioma reprograms H3K27 methylation and gene expression

Affiliations

The histone H3.3K27M mutation in pediatric glioma reprograms H3K27 methylation and gene expression

Kui-Ming Chan et al. Genes Dev. .

Abstract

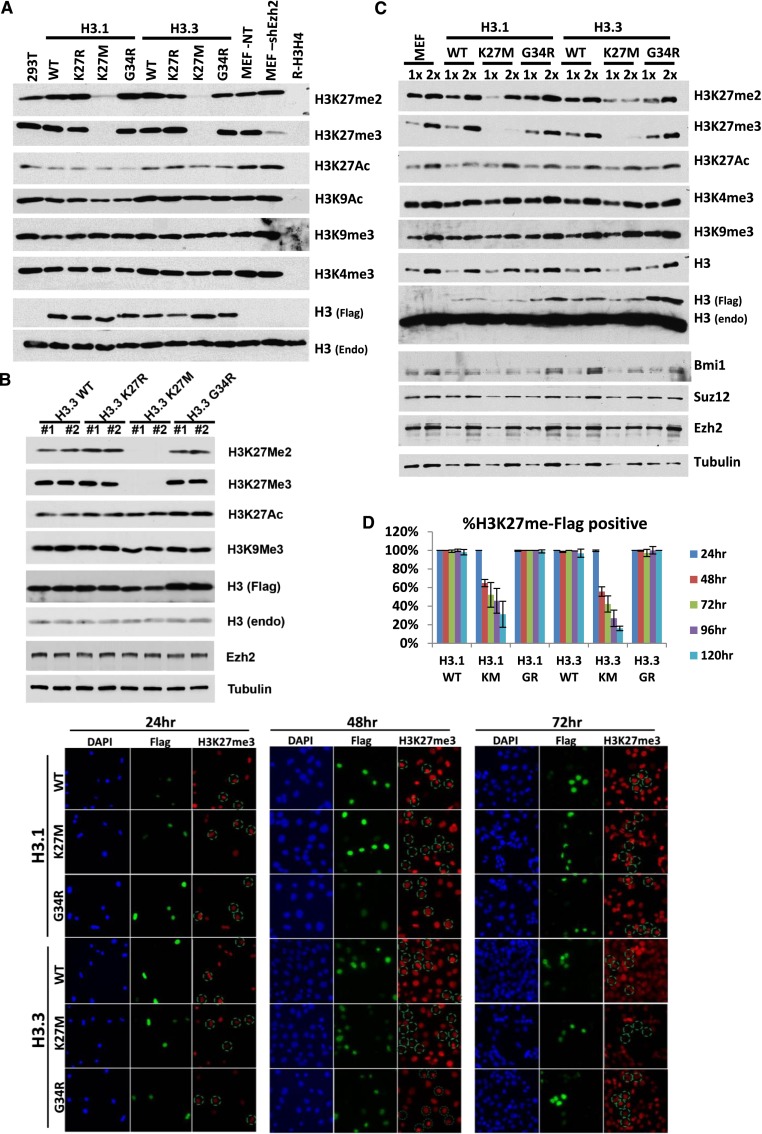
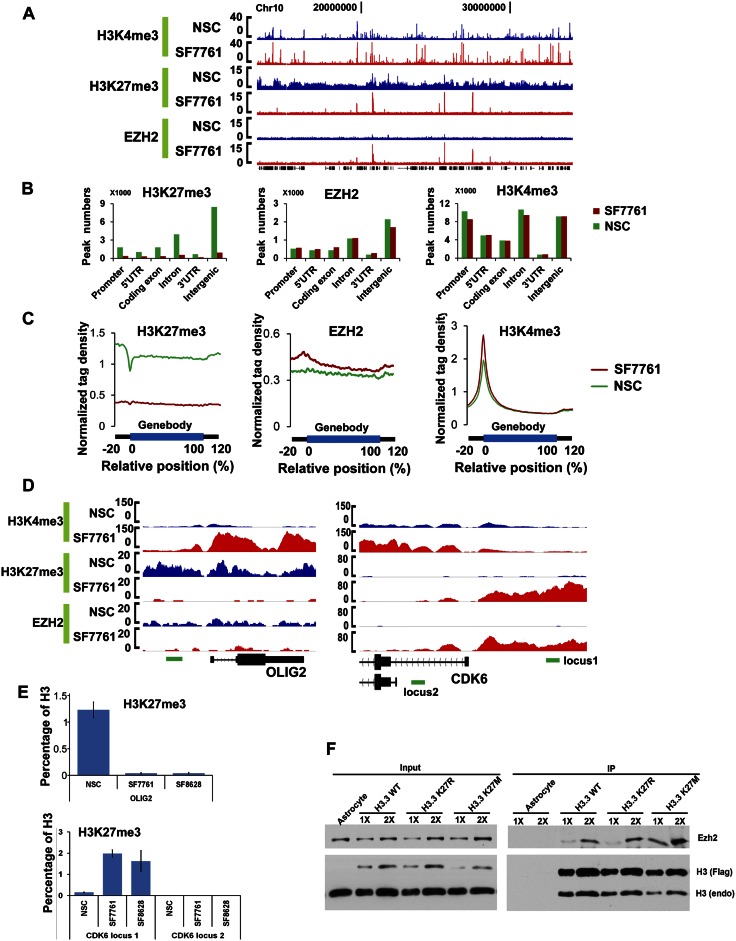
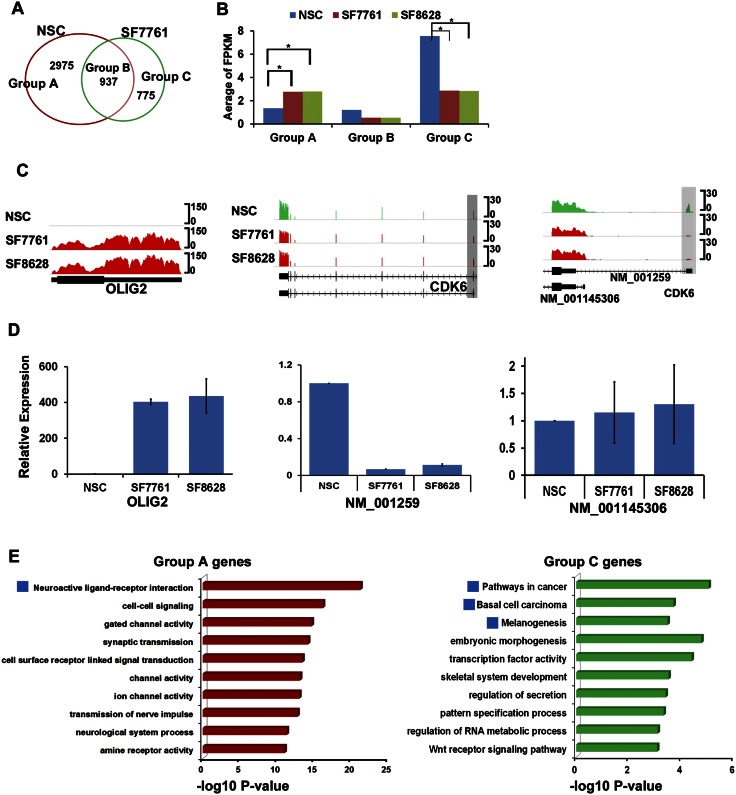
Recent studies have identified a Lys 27-to-methionine (K27M) mutation at one allele of H3F3A, one of the two genes encoding histone H3 variant H3.3, in 60% of high-grade pediatric glioma cases. The median survival of this group of patients after diagnosis is ∼1 yr. Here we show that the levels of H3K27 di- and trimethylation (H3K27me2 and H3K27me3) are reduced globally in H3.3K27M patient samples due to the expression of the H3.3K27M mutant allele. Remarkably, we also observed that H3K27me3 and Ezh2 (the catalytic subunit of H3K27 methyltransferase) at chromatin are dramatically increased locally at hundreds of gene loci in H3.3K27M patient cells. Moreover, the gain of H3K27me3 and Ezh2 at gene promoters alters the expression of genes that are associated with various cancer pathways. These results indicate that H3.3K27M mutation reprograms epigenetic landscape and gene expression, which may drive tumorigenesis.

Keywords: H3.3K27M; H3K27 methylation; PRC2; gliomas; pediatric.


Figures

Figure 1.
Figure 1.
Histone H3K27me2 and H3K27me3 are altered in pediatric DIPG “Histone H3.3 K27M” patient cells. (A) NSC marker NESTIN is expressed in human NSCs and in a xenograft from Histone H3.3 K27M patient DIPG cells (SF7761) but not in cells from a human glioblastoma line with a wild-type histone H3.3 (U251). (B) Histone H3K27 methylation is specifically altered in H3.3K27M cells. Recombinant histone H3–H4 proteins purified from bacteria (R-H3H4) served as a control to show the specificity of antibodies against modified histone H3 variants. Lysates from mouse embryonic fibroblasts (MEFs) infected with nontargeting (NT) control and Ezh2 shRNA knockdown viruses were used to demonstrate the specificity of the H3K27me2 and H3K27me3 antibodies. (C) H3K27me2 and H3K27me3 are reduced in two H3.3K27M patient lines but not in adult GBM, as indicated by immunofluorescence staining. Bar, 5 μm.
Figure 2.
Figure 2.
Ectopic expression of Histone H3.1 and H3.3 K27M mutants alters endogenous histone H3K27 methylation. (A) Lysates collected from individual 293T clones stably expressing Flag-tagged wild-type (WT) human histone H3.1 and H3.3 or mutant (K27R, K27M, or G34R) histone proteins were subjected to Western blotting. Recombinant histone (R-H3–H4) purified from bacteria and lysates from MEFs infected with Ezh2 shRNA served as controls to show the specificity of the antibodies. (B) H3.3K27M mutant histones alter endogenous H3K27me2 and H3K27me3 in human astrocyte cell lines. Two individual clones were analyzed. The experiments were performed as described in A. (C) H3.1 and H3.3 K27M mutant histones specifically alter endogenous H3K27me2 and H3K27me3 in MEF cells. Lysates from individual stable clones were collected and subjected to Western blotting. (D) Loss of H3K27me3 in MEF cells expressing histone H3.1 or H3.3 K27M mutant proteins is gradual. Immunofluorescence photographs of Flag-tagged wild-type or mutant histone H3.1 and H3.3 proteins expressed in MEF cells and monitored over time for changes in H3K27me3. The corresponding bar chart shows the percentage of wild-type H3 or H3 mutant-expressing cells with H3K27me3 staining. Results were averaged from two independent experiments (n > 200). Bar, 5 μm.
Figure 3.
Figure 3.
Genome-wide mapping of H3K4me3, H3K27me3, and EZH2 in NSCs and SF7761 (H3.3K27M DIPG patient). (A) The distribution of H3K4me3, H3K27me3, and EZH2 in the region of chromosomes 10:21,243,862–31,717,550. RefSeq genes are shown at the bottom. (B) H3K4me3, H3K27me3, and EZH2 gene structural element associations in NSCs (green) and SF7761 cells (red). Promoters were defined as −2 kb to +1 kb relative to transcription start site (TSS). (C) Normalized tag distribution profiles of H3K4me3, H3K27me3, and EZH2 peaks across gene body regions. Each gene body was normalized to 0%–100%, with 20% upstream of and 20% downstream from the gene body shown. (D) Genome browser track examples for the occupancy profiles of two genes: OLIG2 and CKD6. (E) ChIP-qPCR analysis to validate the H3K27me3 ChIP-seq results at the OLIG2 and CDK6 loci. (F) Ezh2 copurifies to a greater extent with exogenously expressed H3.3 K27M than with H3.3 wild type (WT) and K27R in vivo. H3.3 mononucleosomes were immunoprecipitated from astrocyte cells stably expressing the Flag-tagged H3.3 K27M mutant. The same purification procedures were performed using normal astrocytes as a negative control. Proteins in whole-cell extracts (Input) and immunoprecipitates (IP) were analyzed by Western blotting using the indicated antibodies.
Figure 4.
Figure 4.
Whole-genome changes in H3K27me3 chromatin association in H3.3K27M DIPG affects gene expression. (A) Venn diagram showing the extent of overlap between the genes with H3K27me3 at the promoters in NSCs versus SF6671 cells. Promoters were defined as −2 kb to +1 kb relative to the TSS. From these results, genes were classified into three groups according to promoter occupancy of H3K27me3 in NSC versus SF7761. Group A genes exhibited H3K27me3 peaks only in NSCs, group B genes showed H3K27me3 peaks in both NSCs and SF7761 cells, and group C genes showed H3K27me3 peaks only in SF7761 cells. (B) Average expression for each of the three groups of genes. SF8628 is another DIPG patient line containing the H3.3K27M mutation. FPKM (fragments per kilobase of exon per million fragments mapped) was calculated by using Cufflinks software. (*) P < 0.01. (C) Genome browser track examples of OLIG2 and CKD6 from RNA-seq analysis. CDK6 has two isoforms (NM_001259 and NM_001145306) with the different promoters. The gain in H3K27me3 peaks at the NM_001145306 promoter reduces the expression of this isoform. Also see the Supplemental Material. (D) qRT–PCR analysis to validate the RNA-seq data. OLIG2 expression is dramatically elevated in the two H3.3K27M patient cell lines. Expression of the long isoform (NM_001259) of CDK6 was decreased in the two H3.3K27M patient cell lines, while the short isoform (NM_001145306) was unaffected compared with NSCs. (E) The GO pathway analysis results for group A and group C genes are shown. KEGG pathway results in agreement with GO pathway results are indicated by blue squares.

References

    1. Barski A, Cuddapah S, Cui K, Roh TY, Schones DE, Wang Z, Wei G, Chepelev I, Zhao K 2007. High-resolution profiling of histone methylations in the human genome. Cell 129: 823–837 - PubMed
    1. Bernstein BE, Mikkelsen TS, Xie X, Kamal M, Huebert DJ, Cuff J, Fry B, Meissner A, Wernig M, Plath K, et al. 2006. A bivalent chromatin structure marks key developmental genes in embryonic stem cells. Cell 125: 315–326 - PubMed
    1. Buckner JC 2003. Factors influencing survival in high-grade gliomas. Semin Oncol 30: 10–14 - PubMed
    1. Burgess RJ, Zhou H, Han J, Zhang Z 2010. A role for Gcn5 in replication-coupled nucleosome assembly. Mol Cell 37: 469–480 - PMC - PubMed
    1. Chan KM, Zhang Z 2012. Leucine-rich repeat and WD repeat-containing protein 1 is recruited to pericentric heterochromatin by trimethylated lysine 9 of histone H3 and maintains heterochromatin silencing. J Biol Chem 287: 15024–15033 - PMC - PubMed

Publication types