

Structure of the biliverdin cofactor in the Pfr state of bathy and prototypical phytochromes
- PMID: 23603902
- PMCID: PMC3675613
- DOI: 10.1074/jbc.M113.457531
Structure of the biliverdin cofactor in the Pfr state of bathy and prototypical phytochromes
Abstract
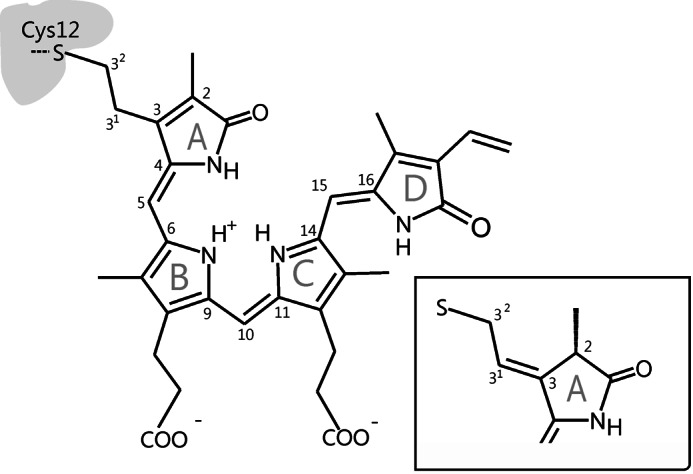
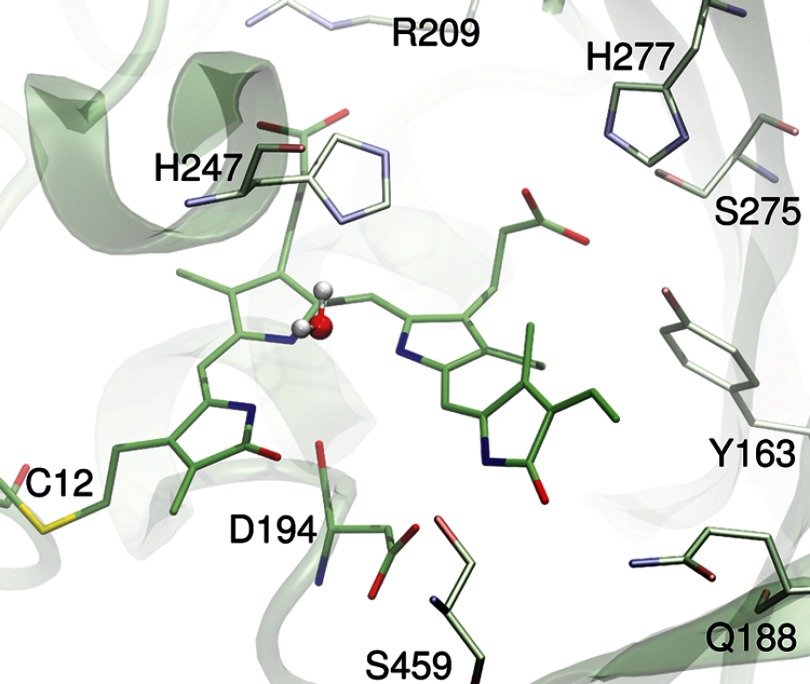
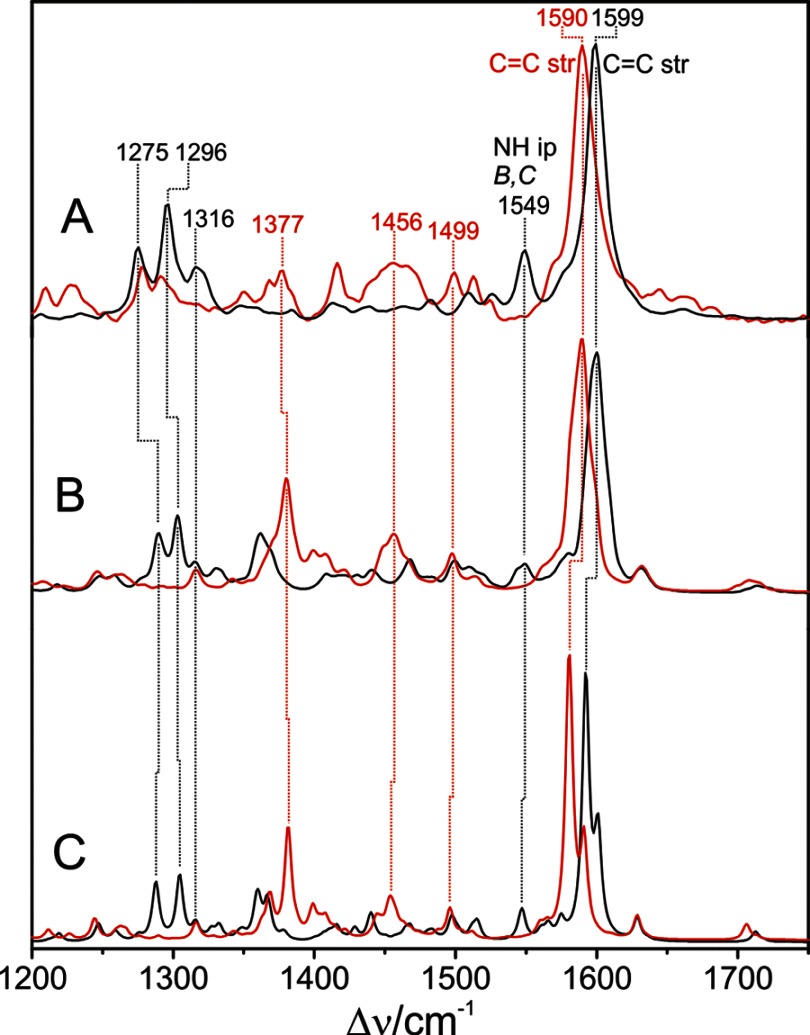
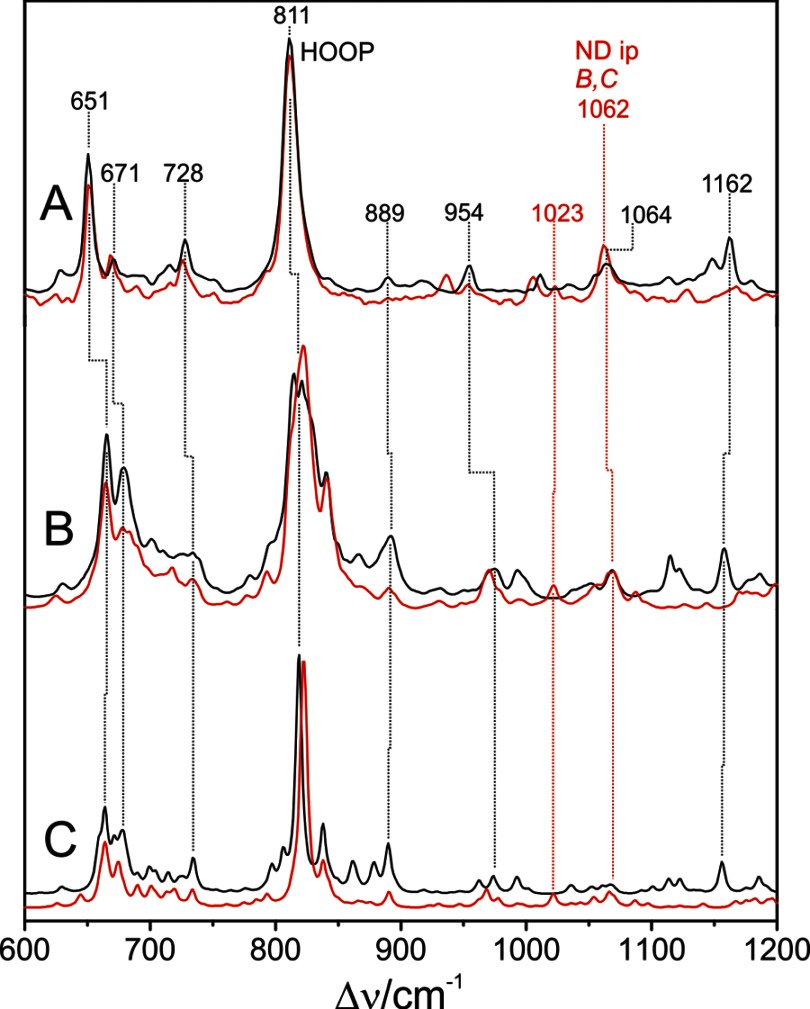
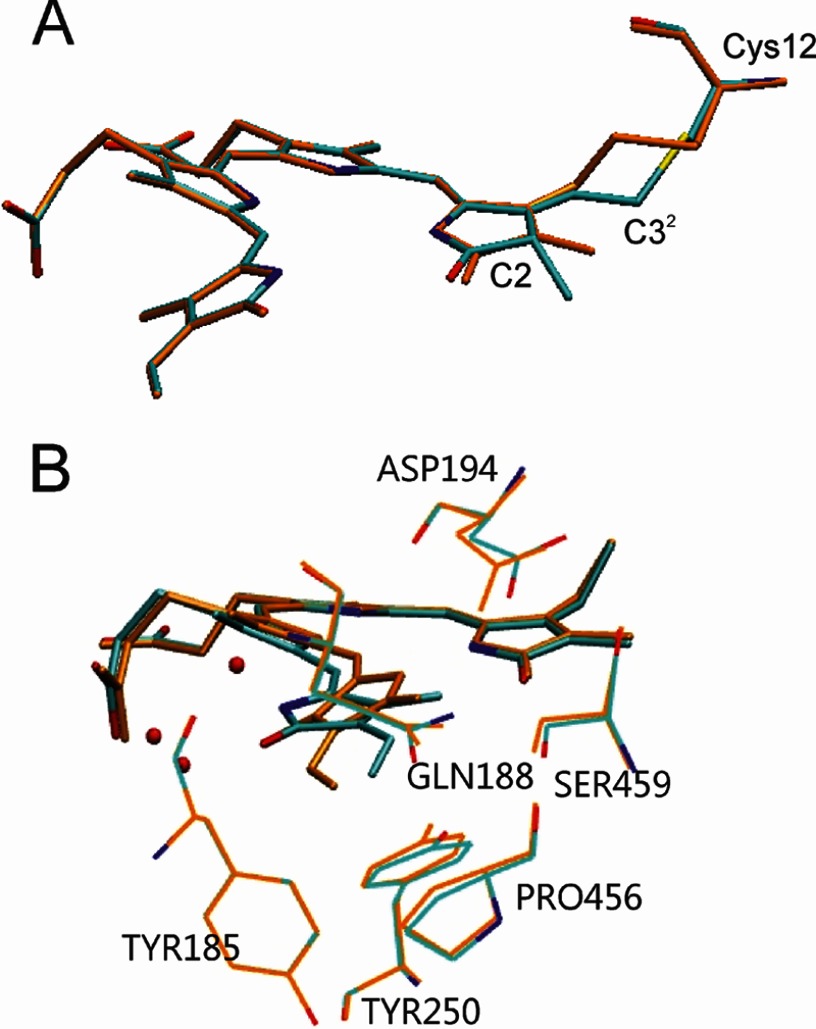
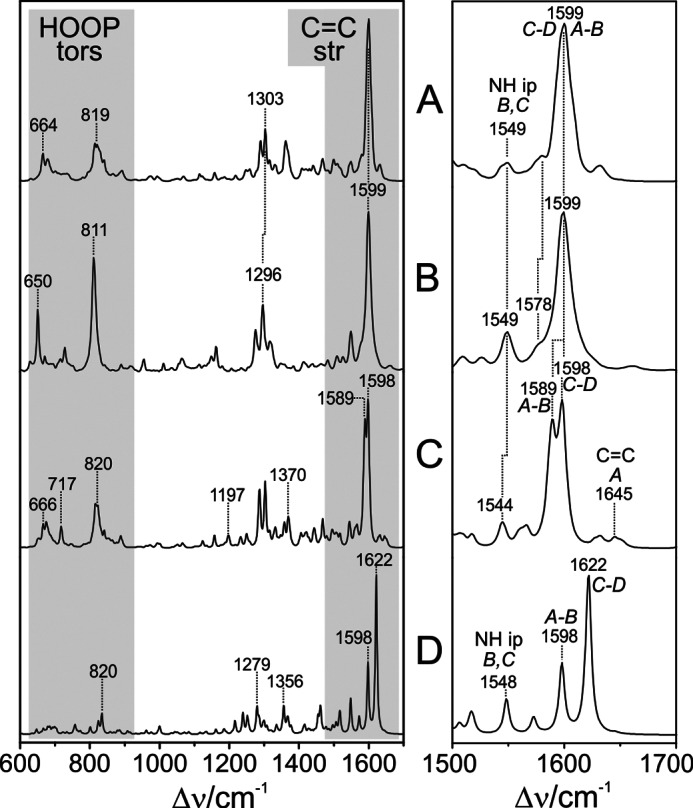
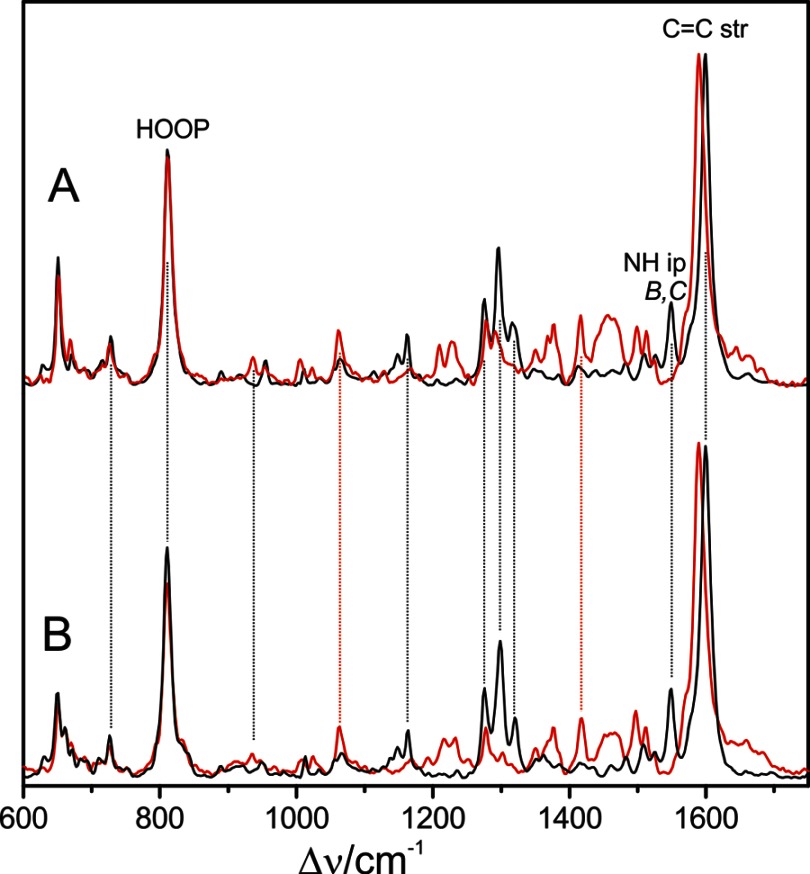
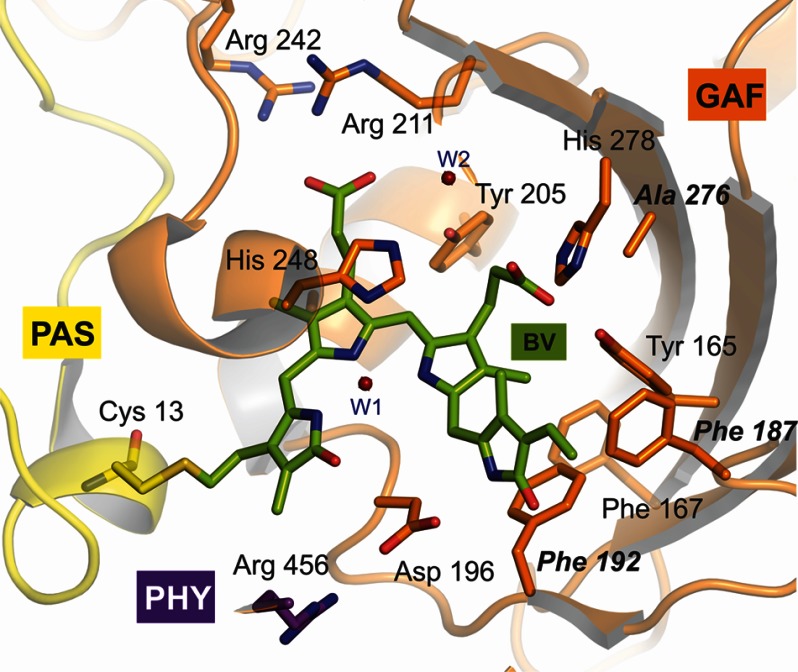
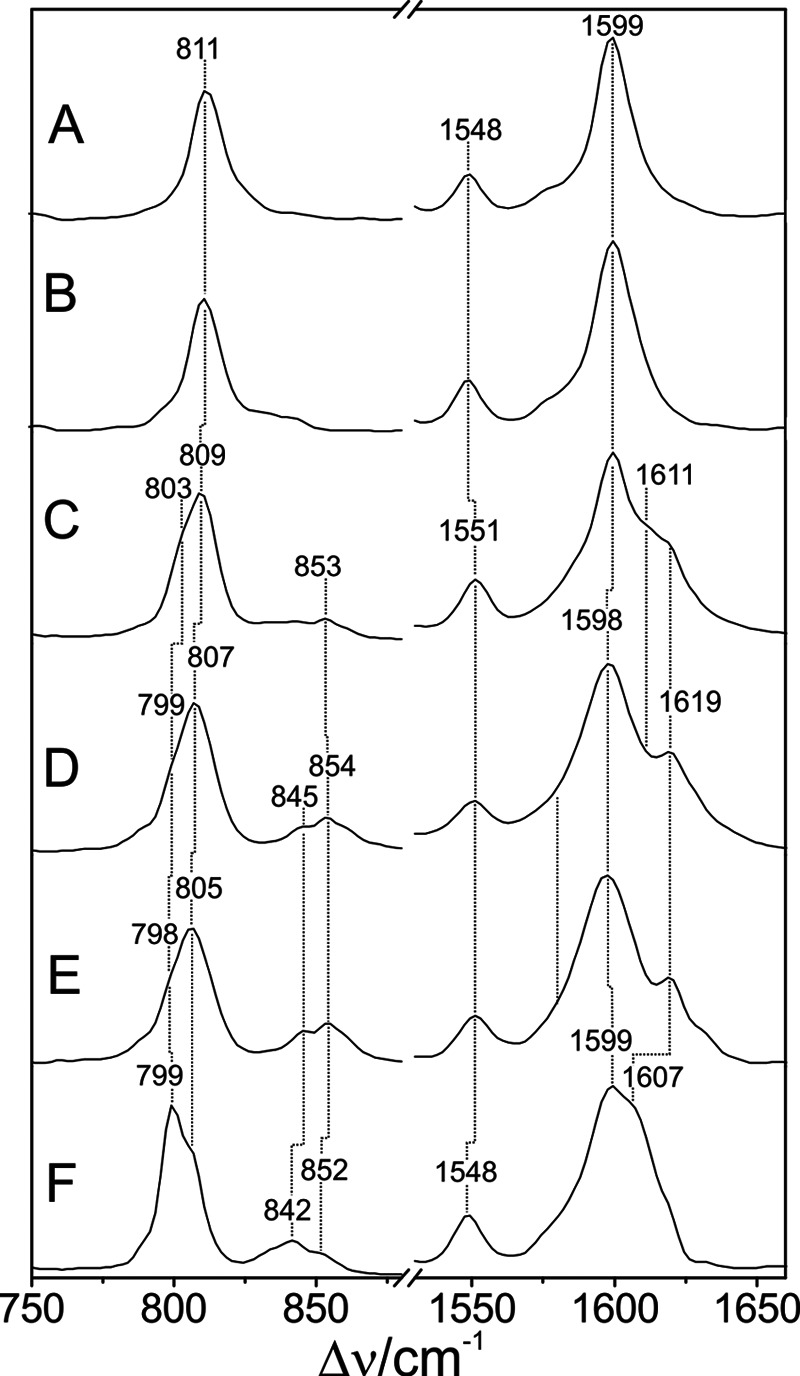
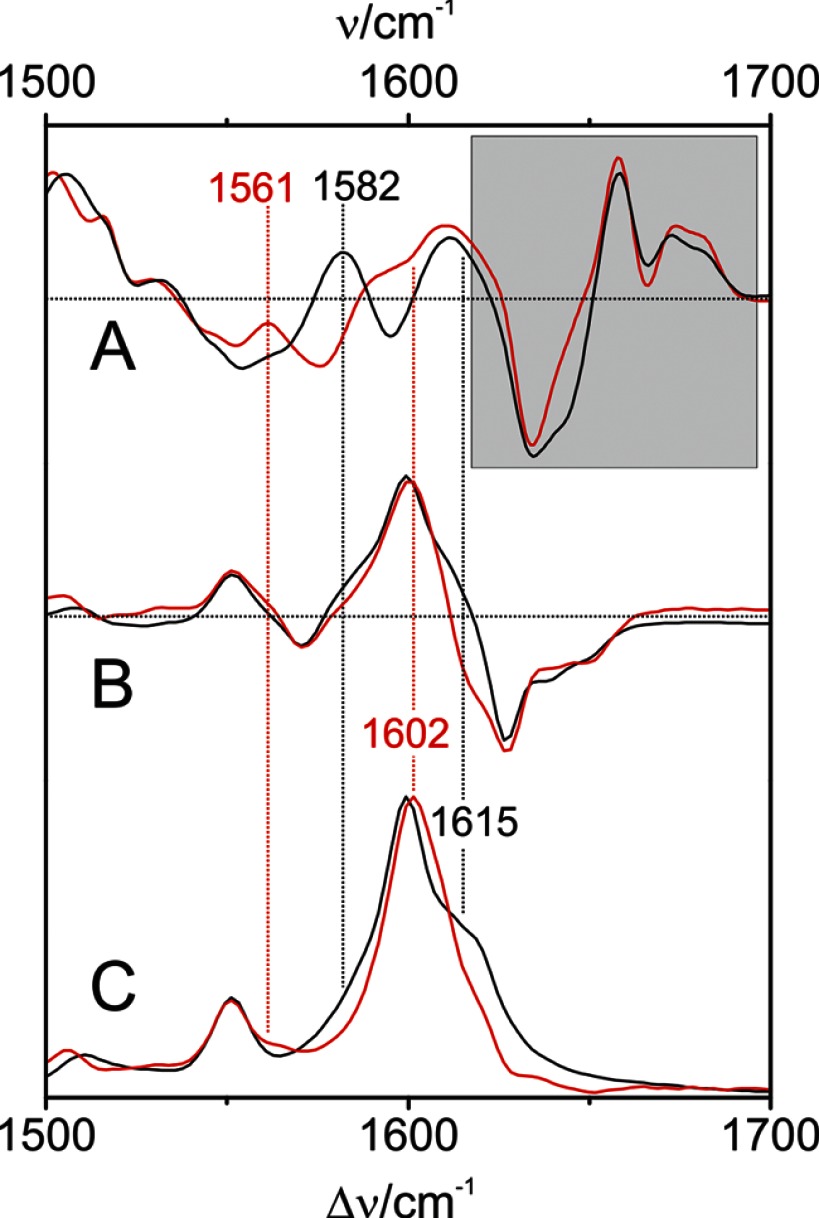
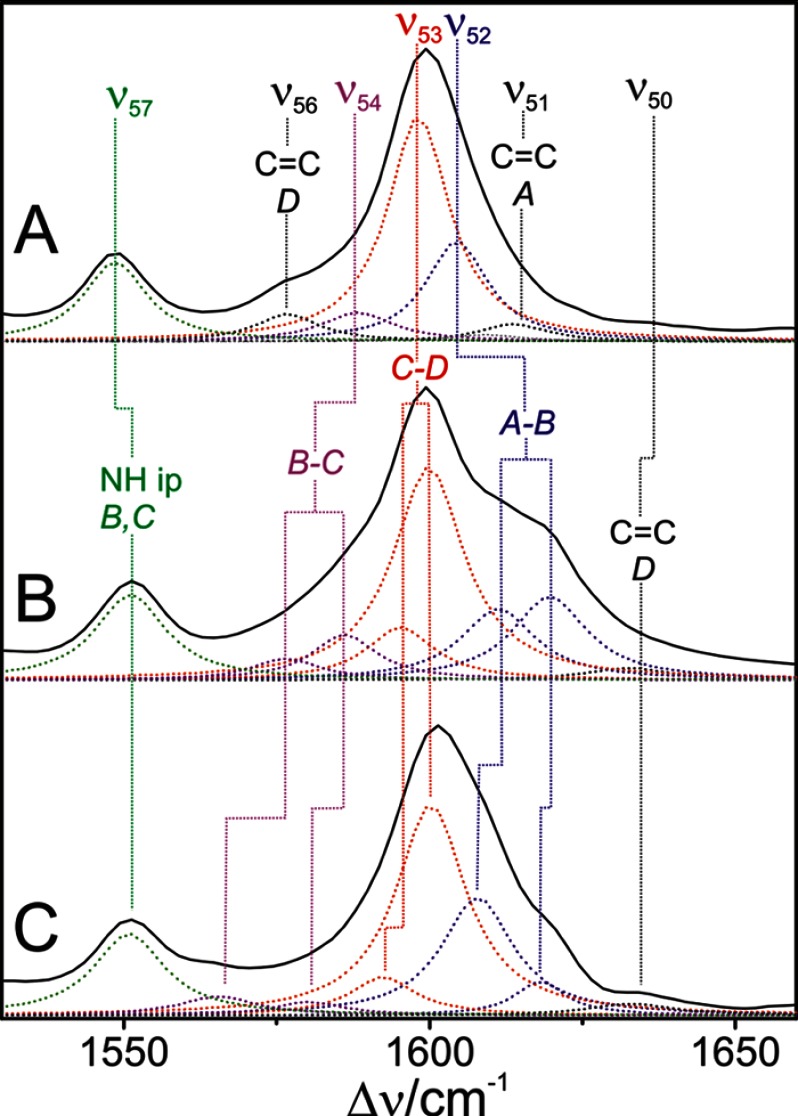
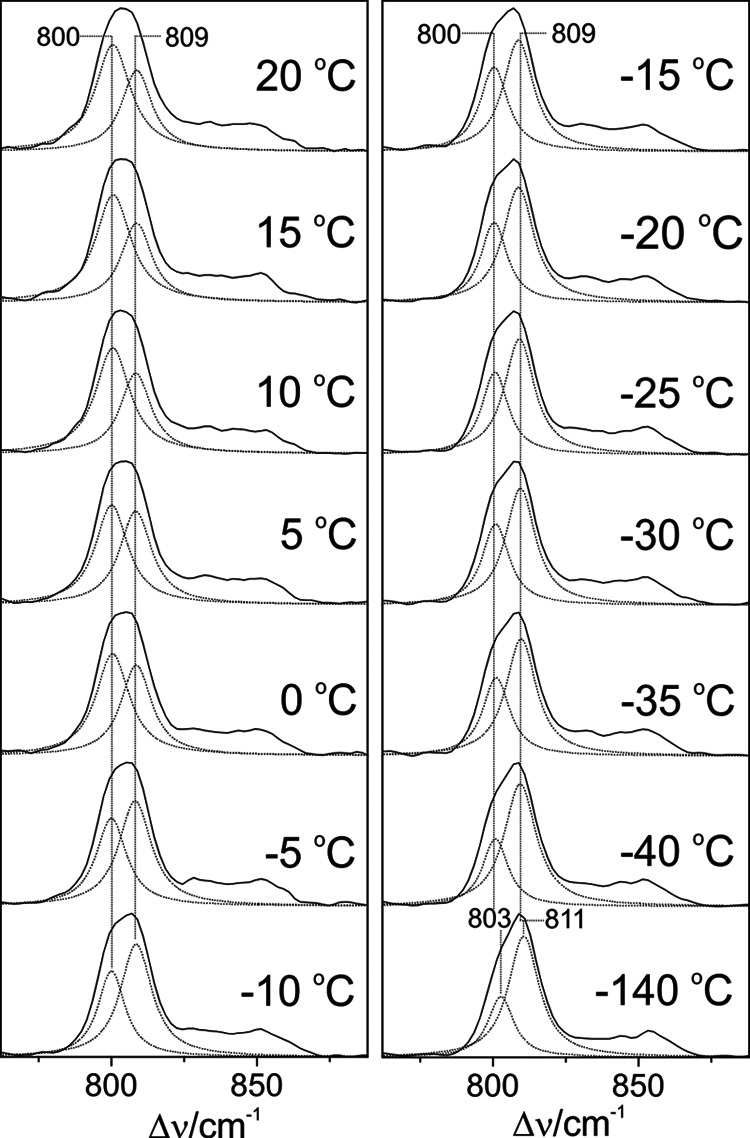
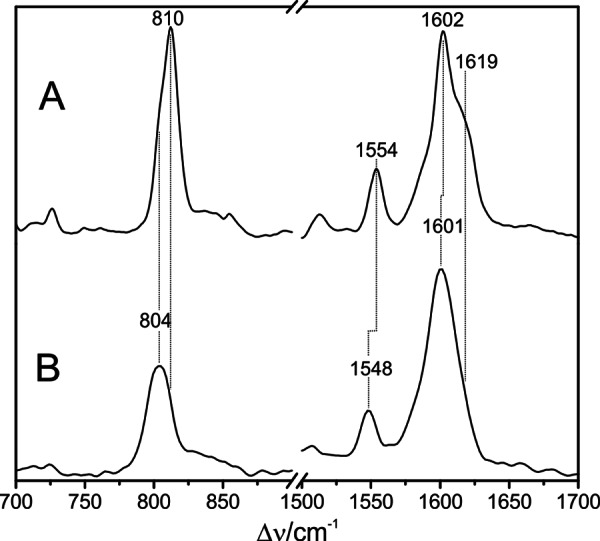
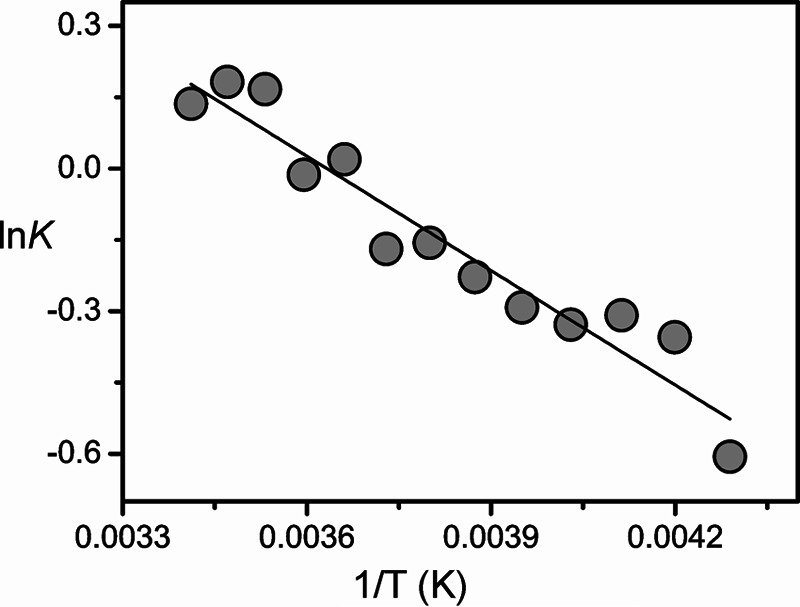
Phytochromes act as photoswitches between the red- and far-red absorbing parent states of phytochromes (Pr and Pfr). Plant phytochromes display an additional thermal conversion route from the physiologically active Pfr to Pr. The same reaction pattern is found in prototypical biliverdin-binding bacteriophytochromes in contrast to the reverse thermal transformation in bathy bacteriophytochromes. However, the molecular origin of the different thermal stabilities of the Pfr states in prototypical and bathy bacteriophytochromes is not known. We analyzed the structures of the chromophore binding pockets in the Pfr states of various bathy and prototypical biliverdin-binding phytochromes using a combined spectroscopic-theoretical approach. For the Pfr state of the bathy phytochrome from Pseudomonas aeruginosa, the very good agreement between calculated and experimental Raman spectra of the biliverdin cofactor is in line with important conclusions of previous crystallographic analyses, particularly the ZZEssa configuration of the chromophore and its mode of covalent attachment to the protein. The highly homogeneous chromophore conformation seems to be a unique property of the Pfr states of bathy phytochromes. This is in sharp contrast to the Pfr states of prototypical phytochromes that display conformational equilibria between two sub-states exhibiting small structural differences at the terminal methine bridges A-B and C-D. These differences may mainly root in the interactions of the cofactor with the highly conserved Asp-194 that occur via its carboxylate function in bathy phytochromes. The weaker interactions via the carbonyl function in prototypical phytochromes may lead to a higher structural flexibility of the chromophore pocket opening a reaction channel for the thermal (ZZE → ZZZ) Pfr to Pr back-conversion.
Keywords: Computer Modeling; Infrared Spectroscopy; Photoreceptors; Phytochrome; QM/MM Calculations; Raman Spectroscopy; Resonance Raman; Spectroscopy.
Figures
Similar articles
-
Common Structural Elements in the Chromophore Binding Pocket of the Pfr State of Bathy Phytochromes.Photochem Photobiol. 2017 May;93(3):724-732. doi: 10.1111/php.12742. Photochem Photobiol. 2017. PMID: 28500706
-
Photoinduced reaction mechanisms in prototypical and bathy phytochromes.Phys Chem Chem Phys. 2022 May 18;24(19):11967-11978. doi: 10.1039/d2cp00020b. Phys Chem Chem Phys. 2022. PMID: 35527718
-
Darkness inhibits autokinase activity of bacterial bathy phytochromes.J Biol Chem. 2024 Apr;300(4):107148. doi: 10.1016/j.jbc.2024.107148. Epub 2024 Mar 9. J Biol Chem. 2024. PMID: 38462162 Free PMC article.
-
Phytochrome three-dimensional structures and functions.Biochem Soc Trans. 2010 Apr;38(2):710-6. doi: 10.1042/BST0380710. Biochem Soc Trans. 2010. PMID: 20298248 Review.
-
Light-induced conformational changes of the chromophore and the protein in phytochromes: bacterial phytochromes as model systems.Chemphyschem. 2010 Apr 26;11(6):1090-105. doi: 10.1002/cphc.200900913. Chemphyschem. 2010. PMID: 20373318 Review.
Cited by
-
A genetically encoded far-red fluorescent calcium ion biosensor derived from a biliverdin-binding protein.Protein Sci. 2022 Oct;31(10):e4440. doi: 10.1002/pro.4440. Protein Sci. 2022. PMID: 36173169 Free PMC article.
-
On the Role of the Conserved Histidine at the Chromophore Isomerization Site in Phytochromes.J Phys Chem B. 2021 Dec 23;125(50):13696-13709. doi: 10.1021/acs.jpcb.1c08245. Epub 2021 Nov 29. J Phys Chem B. 2021. PMID: 34843240 Free PMC article.
-
3D Structures of Plant Phytochrome A as Pr and Pfr From Solid-State NMR: Implications for Molecular Function.Front Plant Sci. 2018 Apr 24;9:498. doi: 10.3389/fpls.2018.00498. eCollection 2018. Front Plant Sci. 2018. PMID: 29740459 Free PMC article.
-
Blue protein with red fluorescence.Proc Natl Acad Sci U S A. 2016 Oct 11;113(41):11513-11518. doi: 10.1073/pnas.1525622113. Epub 2016 Sep 29. Proc Natl Acad Sci U S A. 2016. PMID: 27688756 Free PMC article.
-
Dinosaur origin of egg color: oviraptors laid blue-green eggs.PeerJ. 2017 Aug 29;5:e3706. doi: 10.7717/peerj.3706. eCollection 2017. PeerJ. 2017. PMID: 28875070 Free PMC article.
References
-
- Briggs W. R., Spudich J. L. (2005) Handbook of Photosensory Receptors, Wiley Verlag, Weinheim, Germany
-
- Kehoe D. M., Grossman A. R. (1996) Similarity of a chromatic adaptation sensor to phytochrome and ethylene receptors. Science 273, 1409–1412 - PubMed
-
- Hughes J., Lamparter T., Mittmann F., Hartmann E., Gärtner W., Wilde A., Börner T. (1997) A prokaryotic phytochrome. Nature 386, 663. - PubMed
-
- Wilde A., Churin Y., Schubert H., Börner T. (1997) Disruption of a Synechocystis sp. PCC 6803 gene with partial similarity to phytochrome genes alters growth under changing light qualities. FEBS Lett. 406, 89–92 - PubMed
Publication types
MeSH terms
Substances
LinkOut - more resources
Full Text Sources
Other Literature Sources
Research Materials
