. 2013 Aug;20(4):315-24.
doi: 10.1093/dnares/dst012. Epub 2013 Apr 19.

Characterization of the promoter region of an Arabidopsis gene for 9-cis-epoxycarotenoid dioxygenase involved in dehydration-inducible transcription

Affiliations

Characterization of the promoter region of an Arabidopsis gene for 9-cis-epoxycarotenoid dioxygenase involved in dehydration-inducible transcription

Babak Behnam et al. DNA Res. 2013 Aug.

Abstract

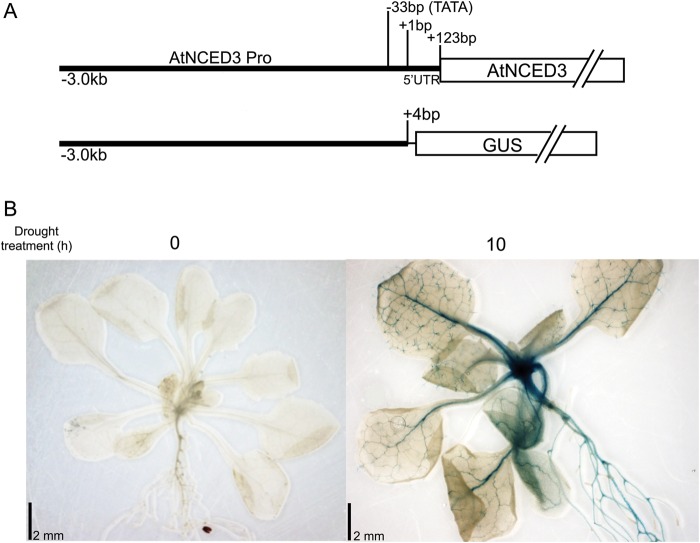
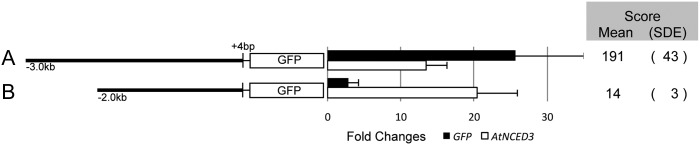
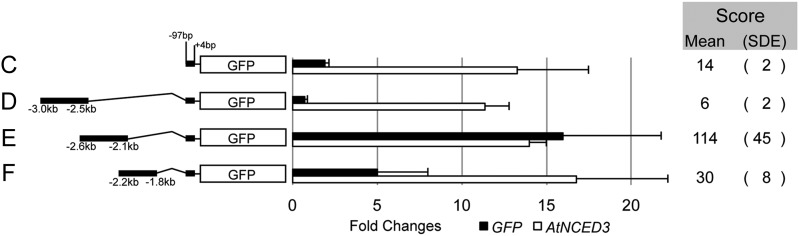
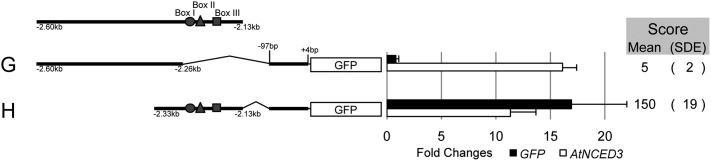
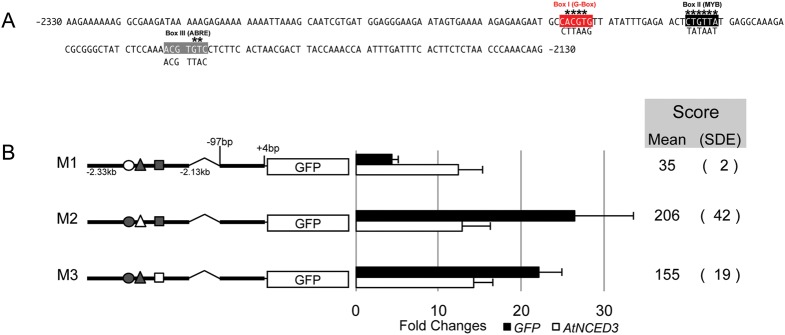
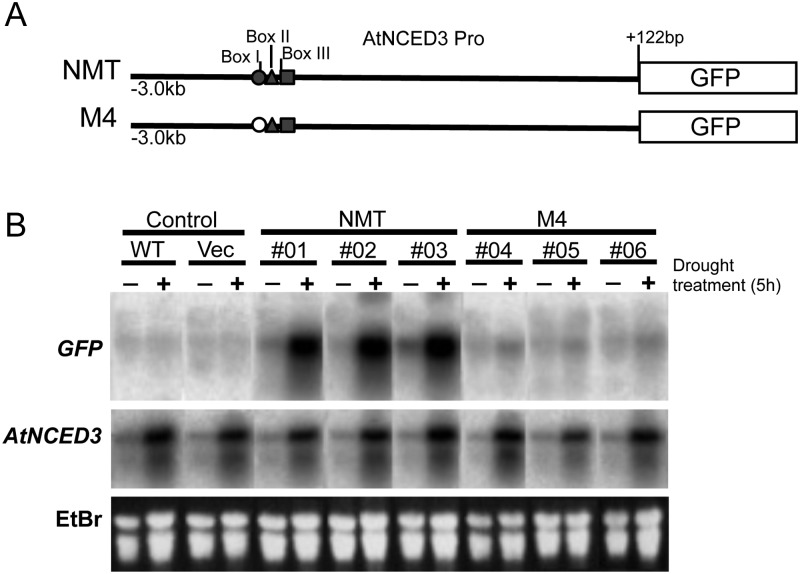
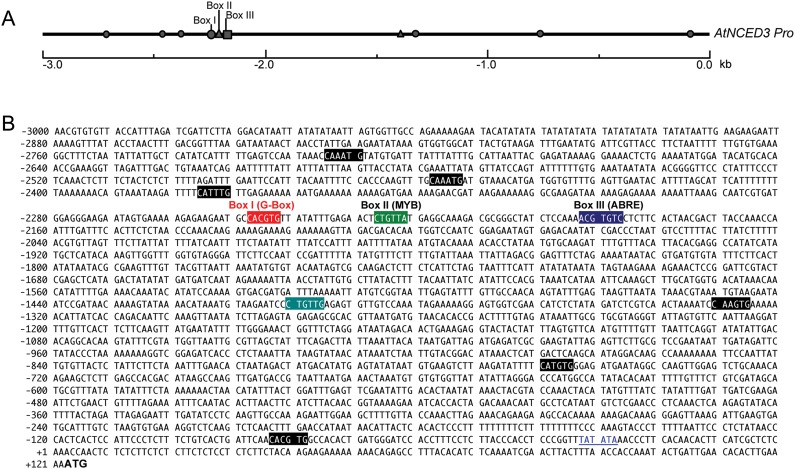
Plants respond to dehydration stress and tolerate water-deficit status through complex physiological and cellular processes. Many genes are induced by water deficit. Abscisic acid (ABA) plays important roles in tolerance to dehydration stress by inducing many stress genes. ABA is synthesized de novo in response to dehydration. Most of the genes involved in ABA biosynthesis have been identified, and they are expressed mainly in leaf vascular tissues. Of the products of such genes, 9-cis-epoxycarotenoid dioxygenase (NCED) is a key enzyme in ABA biosynthesis. One of the five NCED genes in Arabidopsis, AtNCED3, is significantly induced by dehydration. To understand the regulatory mechanism of the early stages of the dehydration stress response, it is important to analyse the transcriptional regulatory systems of AtNCED3. In the present study, we found that an overlapping G-box recognition sequence (5'-CACGTG-3') at -2248 bp from the transcriptional start site of AtNCED3 is an important cis-acting element in the induction of the dehydration response. We discuss the possible transcriptional regulatory system of dehydration-responsive AtNCED3 expression, and how this may control the level of ABA under water-deficit conditions.

Keywords: 9-cis-epoxycarotenoid dioxygenase (NCED); Arabidopsis; AtNCED3; abscisic acid (ABA); cis-acting element; dehydration response.


Figures

Figure 1.
Figure 1.
Tissue-specific expression of the 3.0-kb AtNCED3 promoter fused to the GUS gene in transgenic Arabidopsis plants under dehydration stress conditions. (A) Diagram of the construction of the 3.0-kb AtNCED3 promoter::GUS gene. (B) Histochemical analysis of GUS expression in the 3.0-kb AtNCED3 promoter::GUS transgenic Arabidopsis lines with or without dehydration treatment for 10 h.
Figure 2.
Figure 2.
Deletion fragment of the AtNCED3 promoter fused to GFP. Schematic of 1.0-kb 5′ deletion analysis of 3.0-kb AtNCED3 promoters fused to the GFP reporter gene in related Arabidopsis transgenic T2 lines (left, constructs A and B). Expression of GFP and endogenous AtNCED3 in response to dehydration stress treatment (see the Materials and methods section for details) measured by qRT-PCR (right, transgenic lines containing the A and B constructs). The ratios of GFP mRNA to endogenous AtNCED3 mRNA are expressed as fold changes in expression and are denoted by filled and open boxes, respectively. Error bars indicate the standard deviation of the error (SDE) (n = 3). The score index to the right indicates the mean and related standard error value (n = 3) for each construct (A or B) among related transgenic lines (the details of the score index are described in the Materials and methods section).
Figure 3.
Figure 3.
The 5′ deletion analysis of the −3.0- to −1.8-kb AtNCED3 promoter region involved in dehydration-responsive expression, based on gain-of-function experiments in related transgenic Arabidopsis T2 lines. Schematic diagram of construct C with −97 to +4 bp DNA fragments as a minimal TATA sequence fused to the GFP reporter gene. (Left) In constructs D–F, the GFP reporter gene is fused with the −3.0- to −2.5-kb, −2.6- to −2.1-kb, and −2.3- to −1.8-kb fragments of the minimum promoter, respectively. (Right) Expression of GFP and endogenous AtNCED3 in response to 5 h dehydration treatment among transgenic lines containing constructs C–F, respectively, based on qRT-PCR. The filled and open boxes indicate fold changes in the expression of GFP and endogenous AtNCED3, respectively. Error bars indicate the SDE (n = 3). The score index to the right indicates the mean and related standard error value (n = 3) for each construct (C–F) among related transgenic lines.
Figure 4.
Figure 4.
Analysis of the 0.5-kb region within the −2.60- and −2.10-kb region of the AtNCED3 promoter region involved in dehydration-responsive expression, based on gain-of-function experiments on related transgenic Arabidopsis T2 lines. (Left) Schematic diagram of construct G with the −2.60- to −2.26-kb fragment and construct H with the −2.33- to −2.13-kb fragment fused to the minimum promoter::GFP. (Right) Expression of GFP and endogenous AtNCED3 in response to dehydration stress treatment (5 h) based on qRT-PCR of transgenic lines containing constructs G and H. The filled and open boxes indicate fold changes in the expression of GFP and endogenous AtNCED3, respectively. Error bars indicate the SDE (n = 3). The score index to the right indicates the mean and related standard error value (n = 3) for each construct (G to H) among related transgenic lines.
Figure 5.
Figure 5.
Base substitution analysis of the 0.2-kb region between −2.33- and −2.13-kb of the AtNCED3 promoter involved in dehydration-responsive expression, based on gain-of-function experiments on related transgenic Arabidopsis T2 lines. (A) A 200 bp promoter sequence of AtNCED3, the area between −2.33- and −2.13-kb of the complementary strand, shown in FASTA format. The Box I (CACGTG at −2248 bp) as for G-box motif marked in red, Box II (CTGTTA at −2227 bp) as for Myb recognition motif marked in black and Box III (ACGTGTC at −2193 bp) as for an ABRE sequence marked in grey. The letters under the boxes indicate base substitutions at positions marked by asterisks above the boxes. (B) Schematic diagram of constructs M1–M3 with the 200 bp fragment containing base substitutions. (Right) Expression of GFP and endogenous AtNCED3 in response to dehydration stress (5 h), based on qRT-PCR, among transgenic lines containing the constructs M1, M2, or M3. The filled and open boxes indicate fold changes in the expression of GFP and endogenous AtNCED3, respectively. Error bars indicate the SDE (n = 3). The score index to the right indicates the mean and related standard error value (n = 3) for each construct (M1, M2, and M3) among related transgenic lines.
Figure 6.
Figure 6.
Analysis of the 3.0-kb AtNCED3 promoter region (including the transcription initiation site) involved in dehydration-responsive expression, based on the RNA gel blot analysis of non-mutated and Box I base substitution-related transgenic Arabidopsis T2 lines. (A) Schematic diagram of construct NMT with the 3.0-kb AtNCED3 promoter region without a base substitution at Box I (filled circles), and construct M4 with a base substitution at Box I (CACGTG changed to CTTAAG between −2248 and −2243 bp of the AtNCED3 promoter; opened circles) fused to the GFP reporter gene. (B) GFP and endogenous AtNCED3 expression patterns under dehydration conditions among NMT and M4 transgenic lines. RNA gel blot analysis of Columbia wild-type (WT), three independent Arabidopsis transgenic lines for each construct (NMT and M4), and a control transgenic line consisting of an empty pBE-CD vector with a kanamycin-resistance marker gene (Vec). Two-week-old plants were subjected to dehydration for 5 h (see Material and methods for details). Ethidium bromide-stained total RNA is shown as a loading control. Expression patterns of GFP (upper blot membrane) and endogenous AtNCED3 (lower blot membrane) among control and transgenic plants were analysed by hybridization with 32P-labelled cDNA probes and detected by autoradiography.
Figure 7.
Figure 7.
The sequence of the 3.0-kb AtNCED3 promoter. (A) Schematic diagram of the 3.0-kb AtNCED3 promoter region, showing the relative cis-acting elements. G-Box and Myc recognition consensus sequences (Myc RS) are denoted by filled circles; Myb recognition sequences (Myb RS) are denoted by filled triangles; and ABREs are denoted by filled square. (B) The DNA sequence of the 3.0-kb AtNCED3 promoter. The putative transcription initiation site is defined as the +1 base. The ATG start codon of AtNCED3 is shown in bold. The sequence between +1 and +122 bp represents the 5′ UTR. The putative TATA sequence from −33 to −28 bp is in blue letters. The cis-acting elements shown in A are marked on the DNA sequence as follows: Box I in red box; and Myc RS are in the black box, Box II in green box; Myb RS in dark cyan box, and Box III in the blue box.

Similar articles

Cited by

References

    1. Barnabas B., Jager K., Feher A. The effect of drought and heat stress on reproductive processes in cereals. Plant Cell Environ. 2008;31:11–38. - PubMed
    1. Zhang J.Z., Creelman R.A., Zhu J.K. From laboratory to field. Using information from Arabidopsis to engineer salt, cold, and drought tolerance in crops. Plant Physiol. 2004;135:615–21. doi:10.1104/pp.104.040295. - DOI - PMC - PubMed
    1. Reynolds M., Tuberosa R. Translational research impacting on crop productivity in drought-prone environments. Curr. Opin. Plant Biol. 2008;11:171–9. doi:10.1016/j.pbi.2008.02.005. - DOI - PubMed
    1. Moore J.P., Le N.T., Brandt W.F., Driouich A., Farrant J.M. Towards a systems-based understanding of plant desiccation tolerance. Trends Plant Sci. 2009;14:110–7. doi:10.1016/j.tplants.2008.11.007. - DOI - PubMed
    1. Roy S.J., Tucker E.J., Tester M. Genetic analysis of abiotic stress tolerance in crops. Curr. Opin. Plant Biol. 2011;14:232–9. doi:10.1016/j.pbi.2011.03.002. - DOI - PubMed

Publication types