. 2014 Apr 3;33(14):1776-87.
doi: 10.1038/onc.2013.139. Epub 2013 Apr 22.

Loss of TSC2 confers resistance to ceramide and nutrient deprivation

Affiliations

Loss of TSC2 confers resistance to ceramide and nutrient deprivation

G G Guenther et al. Oncogene. .

Abstract

Nutrient stress that produces quiescence and catabolism in normal cells is lethal to cancer cells, because oncogenic mutations constitutively drive anabolism. One driver of biosynthesis in cancer cells is the mammalian target of rapamycin complex 1 (mTORC1) signaling complex. Activating mTORC1 by deleting its negative regulator tuberous sclerosis complex 2 (TSC2) leads to hypersensitivity to glucose deprivation. We have previously shown that ceramide kills cells in part by triggering nutrient transporter loss and restricting access to extracellular amino acids and glucose, suggesting that TSC2-deficient cells would be hypersensitive to ceramide. However, murine embryonic fibroblasts (MEFs) lacking TSC2 were highly resistant to ceramide-induced death. Consistent with the observation that ceramide limits access to both amino acids and glucose, TSC2(-/-) MEFs also had a survival advantage when extracellular amino acids and glucose were both reduced. As TSC2(-/-) MEFs were resistant to nutrient stress despite sustained mTORC1 activity, we assessed whether mTORC1 signaling might be beneficial under these conditions. In low amino acid and glucose medium, and following ceramide-induced nutrient transporter loss, elevated mTORC1 activity significantly enhanced the adaptive upregulation of new transporter proteins for amino acids and glucose. Strikingly, the introduction of oncogenic Ras abrogated the survival advantage of TSC2(-/-) MEFs upon ceramide treatment most likely by increasing nutrient demand. These results suggest that, in the absence of oncogene-driven biosynthetic demand, mTORC1-dependent translation facilitates the adaptive cellular response to nutrient stress.


Figures

Figure 1
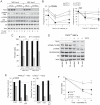
Figure 1. Loss of TSC2 confers resistance to nutrient stress and ceramide
The viability of TSC2+/+ and TSC2−/− MEFs was measured by vital dye exclusion and flow cytometry after glucose deprivation (A), treatment with 20 μM ceramide (B), or 5 μM FTY720 (C), treatment with 100 nM staurosporine (STS) for 24 h (D), or transfer to medium containing 1% the normal amount of amino acids and glucose (E). In all experiments, means from 3-5 experiments are shown +/− SEM. *, p < 0.05 and **, p < 0.01 when results from TSC2+/+ and TSC2−/− MEFs are compared using a t-test.
Figure 2
Figure 2. TSC2−/− MEFs are resistant to ceramide and nutrient stress despite elevated mTORC1 activity
A) TSC2+/+ and TSC2−/− MEFs were maintained in medium containing 1% the normal amount of amino acids and glucose for the indicated interval and mTORC1 signaling evaluated by western blot using a LI-COR Odyssey imager. B,C) The results of (A) were quantified and the signal from phosphorylated p70S6K (B) or ribosomal S6 (C) was expressed relative to the total protein and normalized to the control TSC2+/+ sample. The means from two independent experiments are graphed. D) TSC2+/+ and TSC2−/− MEFs were treated with 20 μM ceramide for the indicated intervals or maintained in 2.5 μM PP242 or nutrient-free medium for 12 h and mTORC1 signaling evaluated by western blot using a LI-COR Odyssey imager. Representative blots are shown. E,F) The results of (D) were quantified as in (B,C). Means +/− SEM are shown for 3 independent experiments. *, p < 0.05 and **, p < 0.01 when results from TSC2+/+ and TSC2−/− MEFs are compared using a t-test. G) As in (D), but Akt phosphorylation at Ser 473 was measured. H) TSC2−/− MEFs expressing HA-tagged Rheb-Q64L (Rheb-GTP) were placed in medium containing 1% the normal amount of amino acids and glucose or treated with ceramide and p70S6 kinase phosphorylation measured at 3 h.
Figure 3
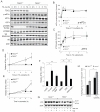
Figure 3. The loss of TSC2 is responsible for the sustained mTORC1 signaling and increased survival in ceramide-treated or nutrient deprived TSC2−/− MEFs
A) Two wild type MEFs lines from different sources were transduced with retroviruses expressing shRNA targeting luciferase or TSC2 and nutrient-deprived for the indicated interval. mTORC1 signaling was evaluated by western blot using a LI-COR Odyssey imager. A representative blot is shown. B) The results of (A) were quantified and the signal from phosphorylated p70S6K (left) or ribosomal S6 (right) was expressed relative to the total protein and normalized to the control TSC2+/+ sample. C) The TSC2 knockdown MEF lines used in (A) were maintained in 1% nutrients for 24 h and viability measured by vital dye exclusion and flow cytometry. In (B&C), means +/− SEM are shown for 3 independent experiments. *, p < 0.05 and **, p < 0.01 when matched shLuc and shTSC2 MEF lines are compared using a t-test. D) TSC2−/− MEFs stably expressing empty vector or human TSC2 were maintained in normal DMEM, treated with 20 μM ceramide or transferred to 1% nutrient medium for 6 h. mTORC1 signaling was evaluated by western blot using a LI-COR Odyssey imager. E) The results of (D) were quantified and the signal from phosphorylated p70S6K (left) or ribosomal S6 (right) was expressed relative to the total protein and normalized to the control TSC2−/− + vector sample. The means from 2 independent experiments are shown. F) TSC2+/+, TSC2−/−, and TSC2−/− + vector MEFs reconstituted with TSC2 were treated with 20 μM ceramide and viability measured at the indicated time points. The averages of 3-4 independent experiments are shown +/− SEM. *, p < 0.05 and **, p < 0.01 when TSC2−/− + vector and TSC2−/− MEFs + TSC2 are compared using a t-test.
Figure 4
Figure 4. Surface amino acid transporter expression rebounds selectively in TSC2−/− MEFs after ceramide treatment and depends on mTORC1 activity and translation
A) 4F2hc staining in TSC2+/+ and TSC2−/− MEFs grown in standard culture medium. B) TSC2+/+ and TSC2−/− MEFs were treated with 20 μM ceramide and surface 4F2hc levels measured by flow cytometry. C) TSC2−/− MEFs stably expressing empty vector or TSC2 were treated with 20 μM ceramide and surface 4F2hc levels measured by flow cytometry. D) Amino acid uptake by TSC2+/+ and TSC2−/− MEFs was measured during the indicated intervals after the addition of 20 μM ceramide. E) TSC2+/+ or TSC2−/− MEFs were treated with ceramide in the presence or absence of 20 mM BCH as indicated. When compared with a t-test, TSC2+/+ with ceramide and TSC2−/− with ceramide and BCH are not significantly different (p = 0.20). F) TSC2+/+ and TSC2−/− MEFs were treated with the indicated drugs and surface 4F2hc levels measured at 12 h (CER, 20 μM ceramide; RAP, 100 nM rapamycin; CHX, 50 μg/ml cycloheximide). G) TSC2+/+ and TSC2−/− MEFs were treated with or without rapamycin and ceramide as indicated and viability measured at 24 h by flow cytometry.
Figure 5
Figure 5. Adaptive nutrient transporter up-regulation is dramatically enhanced in TSC2−/− MEFs
A) TSC2+/+ and TSC2−/− MEFs were incubated in ceramide with or without rapamycin for 12 h, fixed and permeabilized, and total cellular 4F2hc quantified by flow cytometry. B) TSC2+/+ and TSC2−/− MEFs were incubated in medium containing 5% the normal amount of amino acids and glucose for 24 h and surface 4F2hc levels measured by flow cytometry. This degree of nutrient stress does not trigger cell death but causes cell cycle arrest. Where indicated, rapamycin (100 nM), PP242 (2.5 μM), cycloheximide (CHX, 50 μg/ml), or compound C (comp C, 10 μM) were present during the 24 h treatment. C) 4F2hc surface levels in wild type MEF lines stably expressing shRNA against luciferase or TSC2 after 12 h in 1% nutrient medium. D) TSC2+/+ and TSC2−/− MEFs were incubated in medium containing either 1% or 5% the normal amount of amino acids and glucose, 1% glucose, or 1% the normal amount of amino acids and surface levels of GLUT1 measured by flow cytometry at 12 h. E) As in (D), but cells were treated with ceramide for 12 h. F) TSC2+/+ and TSC2−/− MEFs treated with ceramide for 12 h before 2-deoxy-glucose uptake was measured. In all panels, averages of 3-13 independent experiments are shown +/− SEM. n.s., not significant (p > 0.05); *, p < 0.05; and **, p < 0.01 using a t-test to compare the indicated samples.
Figure 6
Figure 6. eIF2α activation and autophagy are similarly enhanced in in nutrient-stressed TSC2+/+ and TSC2−/− MEFs
A) TSC2+/+ and TSC2−/− MEFs were maintained in 1% nutrient medium for the indicated interval. eIF2α and mTORC1 signaling was evaluated by western blot using a LI-COR Odyssey imager. Thapsigargin (2 μM, TG) was used as a positive control for eIF2α activation. B,C) eIF2α phosphorylation was quantified and expressed relative to total eIF2α (B); total ATF4 levels were also quantified (C). Values were normalized to the signal in untreated TSC2+/+ samples and the averages of 3 independent experiments plotted +/− SEM. D,E) mRNA was isolated from TSC2+/+ or TSC2−/− MEFs maintained in standard medium and DMEM containing 1% nutrients (D) or 15 μM ceramide (E). 4F2hc mRNA levels were measured using quantitative RT-PCR and expressed relative to actin mRNA. F) As in (D,E) except that 100 nM rapamycin (rap) was added where indicated; 1% nutrient treatment was for 8 h, ceramide treatment was for 12 h. G,H) TSC2+/+ and TSC2−/− MEFs were maintained in 1% nutrient medium for 3 h in the presence or absence of 25 μM chloroquine (CQ) and LC3-II levels measured by western blotting. A representative blot is shown (G); average ratios of LC3-II intensity +/− chloroquine are plotted +/− SEM as a measure of autophagic flux. In all panels, average results of 3 independent experiments are shown +/− SEM. *, p ≤ 0.05; **, p ≤ 0.01. In 6F, p = 0.37 when comparing 1% nutrients +/− rapamycin.
Figure 7
Figure 7. Loss of TSC2 does not protect from nutrient stress in the presence of oncogenic Ras
A) TSC2+/+ and TSC2−/− MEFs stably expressing H-RasG12V were treated with ceramide and viability measured at 24 h. B) TSC2+/+ or TSC2−/− MEFs expressing oncogenic Ras were treated with 20 μM ceramide or maintained in 1% nutrient medium for 6 h and mTORC1 signaling was evaluated by western blot using a LI-COR Odyssey imager. C) The results of (B) were quantified and the phosphorylation of p70S6K and S6 expressed relative to their respective total protein signals and normalized to TSC2+/+ MEFs + vector. D) TSC2−/− MEFs stably expressing H-RasG12V were treated with ceramide +/− 10 μM U0126 and viability measured at 24 h. E) TSC2+/+ or TSC2−/− MEFs expressing empty vector or oncogenic Ras were treated with 20 μM ceramide for 12 h and ATP levels were measured. F) As in (E), but surface 4F2hc levels measured by flow cytometry. In all panels, averages of at least 3 independent experiments are shown +/− SEM. n.s., not significant (p > 0.05); *, p < 0.05; and **, p < 0.01 when the indicated samples were compared using a t-test. In panel E, when TSC2+/+ and TSC2−/− vector cells were compared with a t-test, p = 0.16; for Ras-expressing cells p = 0.83.
Figure 8
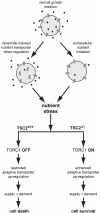
Figure 8. Model for the resistance of TSC2−/− MEFs to nutrient stress
Loss of surface nutrient transporter proteins or extracellular nutrient limitation produces nutrient stress. In wildtype MEFs, mTORC1 is inactive and the limited adaptive response is insufficient to relieve the nutrient stress, eventually leading to cell death. In TSC2−/− MEFs, in contrast, an enhanced adaptive up-regulation of nutrient transporters occurs via mTORC1-driven translation and possibly transcription. In the absence of oncogene-driven anabolism, the resulting increase in nutrient uptake is sufficient to protect TSC2−/− MEFs from death. When oncogenic Ras increases nutrient demand and/or reprograms metabolism, nutrient transporter up-regulation is compromised and the survival advantage of TSC2−/− MEFs is lost.

Similar articles

Cited by

References

    1. Dazert E, Hall MN. mTOR signaling in disease. Curr Opin Cell Biol. 2011;23:744–55. - PubMed
    1. Yecies JL, Manning BD. mTOR links oncogenic signaling to tumor cell metabolism. Journal of molecular medicine. 2011;89:221–8. - PubMed
    1. Curatolo P, Bombardieri R, Jozwiak S. Tuberous sclerosis. Lancet. 2008;372:657–68. - PubMed
    1. Dibble CC, Elis W, Menon S, Qin W, Klekota J, Asara JM, et al. TBC1D7 is a third subunit of the TSC1-TSC2 complex upstream of mTORC1. Mol Cell. 2012;47:535–46. - PMC - PubMed
    1. Huang J, Manning BD. The TSC1-TSC2 complex: a molecular switchboard controlling cell growth. Biochem J. 2008;412:179–90. - PMC - PubMed

Publication types

MeSH terms