. 2013:3:1689.
doi: 10.1038/srep01689.

RNA sequencing of cancer reveals novel splicing alterations

Affiliations

RNA sequencing of cancer reveals novel splicing alterations

Jeyanthy Eswaran et al. Sci Rep. 2013.

Abstract

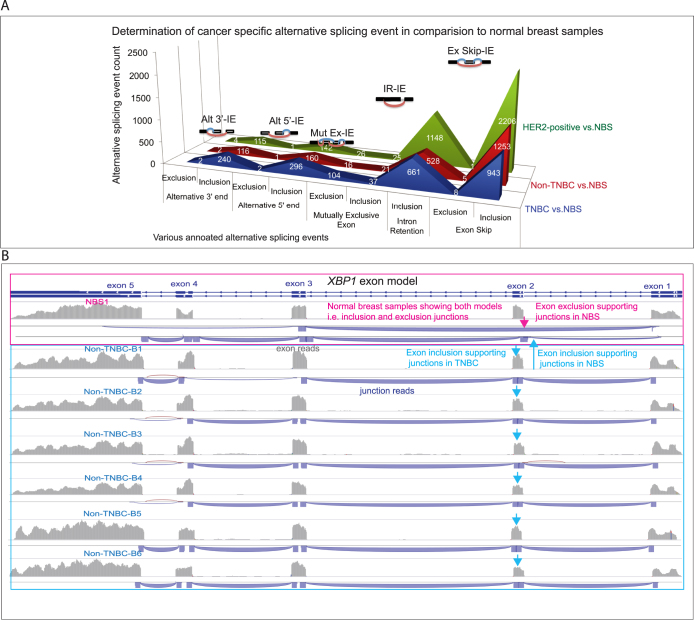
Breast cancer transcriptome acquires a myriad of regulation changes, and splicing is critical for the cell to "tailor-make" specific functional transcripts. We systematically revealed splicing signatures of the three most common types of breast tumors using RNA sequencing: TNBC, non-TNBC and HER2-positive breast cancer. We discovered subtype specific differentially spliced genes and splice isoforms not previously recognized in human transcriptome. Further, we showed that exon skip and intron retention are predominant splice events in breast cancer. In addition, we found that differential expression of primary transcripts and promoter switching are significantly deregulated in breast cancer compared to normal breast. We validated the presence of novel hybrid isoforms of critical molecules like CDK4, LARP1, ADD3, and PHLPP2. Our study provides the first comprehensive portrait of transcriptional and splicing signatures specific to breast cancer sub-types, as well as previously unknown transcripts that prompt the need for complete annotation of tissue and disease specific transcriptome.


Figures

Figure 1
Figure 1. TNBC, non-TNBC and HER2-positive breast cancer RNA sequencing.
(A) Overview of the steps involved in the splicing and transcriptional regulatory elements that are specific to TNBC, non-TNBC and HER2-positive breast cancers in comparison to NBS using de novo assembled transcripts from RNA sequencing. (B) Total read distribution between NBS and cancer – higher proportion of intergenic reads is found in the cancer as compared to NBS. (C) Relative distribution of novel, identical to reference, and mapping into the reference transcripts in the four studied groups. (D) Overlap of the novel isoforms between the three breast cancer subtypes.
Figure 2
Figure 2. Differentially spliced genes and their associated isoforms between NBS and TNBC, non-TNBC and HER2-positive breast cancers.
(A-C) Circos plots representing the statistically significant, differentially spliced genes identified through pairwise comparisons of TNBC vs. NBS (A), non-TNBC vs. NBS (B), and HER2-positive vs. NBS (C). The genes shown as dots are coloured based on their Jensen-Shannon divergence test q value. The stacked histograms represent the abundance (FPKM) of specific differentially spliced isoforms that results from the primary transcripts. (D) Close view of chromosome 6 segment of TNBC vs. NBS comparison of differentially splicing genes, exemplified through SYNE1 novel splice variant expression dynamics shown as a line graph. Tcon numbers indicate the reassembled, distinct novel exon models of SYNE1. (E) Statistically significant differentially splicing genes and their associated isoforms – comparison with NBT.
Figure 3
Figure 3. TNBC, non-TNBC and HER2-positive breast cancers specific isoforms.
Heat map showing the top twenty novel junctions differentially expressed isoforms among the three cancer subtypes. Red color indicates high expression levels, and green color indicates low expression levels. The top twenty are selected based on their abundance (FPKM values shown on the heat map) in TNBC (A), non-TNBC (B) and HER2-positive (C). The gene names are shown on the right and the closest emsembl transcript identifier is presented on the left of each heat map.
Figure 4
Figure 4. Quantitative real time PCR (qRT-PCR) experimental validation of differential expression of cancer subtype specific isoforms as compared to NBS: (A) TNBC, (B) Non-TNBC, and (C) HER2 positive.
A good correlation between RNA-sequencing and qRT-PCR data is observed.
Figure 5
Figure 5. Identification of differential primary transcripts, promoter usage and promoter switch in breast cancers.
(A) The volcano plots show the statistically significant primary transcripts (in blue, corrected p < 0.05 and FDR < 0.05), identified in the comparisons of TNBC vs. NBS, non-TNBC vs. NBS, and HER2-positive vs. NBS pair wise comparisons using cuffdiff program. (B) The relative abundance of all the primary transcripts associated with TFAP2A, a gene that is involved in differential promoter usage in TNBC, non-TNBC and HER2-positive breast cancers. All the primary transcripts (TSSs) of TFAP2A and their abundances are shown. The primary transcripts (TSS) that produce isoforms identical to a known ensembl transcript are shown in different colour other than black. The novel isoforms that share at least one splice junction with ENST00000489805 isoform of TFAP2A are shown in black.
Figure 6
Figure 6. Annotation of novel splice events.
(A) Peaks graph showing the inclusion or exclusion of exons that occur in the individual breast cancer subtypes in comparison to NBS. The exact inclusion or exclusion event count is shown on the relevant peak. (B) An example of “switch like” exon occurrence in XBP1, encoding potent transcription factor. In normal breast samples sample, the junctions and reads support the possibility of two types of isoforms that include or exclude exon 2 in XBP1. In contrast, in all six non-TNBC breast cancer type, the reads encode the entire five exons, supporting only the potent DNA binding domain intact splice variant expression.
Figure 7
Figure 7. Validation of novel cancer specific isoforms at cDNA and protein level.
(A) CDK4 novel isoform identified in non-TNBC validated by RT-PCR. The left side panel shows the relative abundance of all the primary transcripts. The red arrow points to a pie chart that shows the relative abundance of all the isoforms that originate from the TSS129057. The lower bar chart shows the relative abundance of isoforms that are generated from the TSSs shown in the middle panel. To indicate the origin of the isoforms, the bars are color coded similar to their primary transcript color. The right side panel shows a novel isoform that is formed through a junction merging two CDK4 isoforms, ENST00000257904 and ENST00000552862, and skipping the first non-coding exon of ENST00000257904. The novel isoform does not change coding sequence. The RT-PCR gel electrophoresis is shown on the right. (B) LARP1 novel isoform identified in non-TNBC samples by RNA sequencing and validated by RT-PCR (gel on the right, the box indicates the region that was amplified by RT-PCR). (C) PHLPP2 novel isoform identified in TNBC samples by RNA sequencing and validated by RT-PCR (gel on the right, the box indicates the region that was amplified by RT-PCR). (D) Validation of novel isoforms identified in cancer samples in breast cancer cell lines. LARP1 RT-PCR product was detected in MCF7 only, and PHLPP2 was detected in MCF7 and HS578T; in contrast the CDK novel isoform was detected in all eight screened cell lines. (E) LARP1 novel protein isoform validation by Western blot analysis in breast cancer cell lines. An additional band, corresponding to the predicted novel isoform of 1096AA (as compared to 1019 in the wild type) is identified by LARP1 specific antibody. Congruent with RT-PCR results, the novel longer LARP1 isoform was detected in MCF-7 and not in the remaining tested breast cancer cell lines. (F) PHLPP2 novel protein isoform validation by Western blot analysis in breast cancer cell lines. The novel shorter (1256AA) as compared to the wild type (1323AA) isoform was identified in MCF7 and HS578T cell lines, in line with RT-PCR results.

Similar articles

Cited by

References

    1. Stratton M. R. & Wooster R. Hereditary predisposition to breast cancer. Curr Opin Genet Dev 6, 93–97 (1996). - PubMed
    1. Turnbull C. & Rahman N. Genetic predisposition to breast cancer: past, present, and future. Annu Rev Genomics Hum Genet 9, 321–345 (2008). - PubMed
    1. Robertson L. et al. BRCA1 testing should be offered to individuals with triple-negative breast cancer diagnosed below 50 years. Br J Cancer 106, 1234–1238. - PMC - PubMed
    1. Wang E. T. et al. Alternative isoform regulation in human tissue transcriptomes. Nature 456, 470–476 (2008). - PMC - PubMed
    1. Eswaran J. et al. Transcriptomic landscape of breast cancers through mRNA sequencing. Sci Rep 2, 264 (2012). - PMC - PubMed

Publication types