. 2013 Jun;15(6):647-58.
doi: 10.1038/ncb2718. Epub 2013 Apr 21.

TFEB controls cellular lipid metabolism through a starvation-induced autoregulatory loop

Affiliations

TFEB controls cellular lipid metabolism through a starvation-induced autoregulatory loop

Carmine Settembre et al. Nat Cell Biol. 2013 Jun.

Erratum in

  • Nat Cell Biol. 2013 Aug;15(8):1016

Abstract

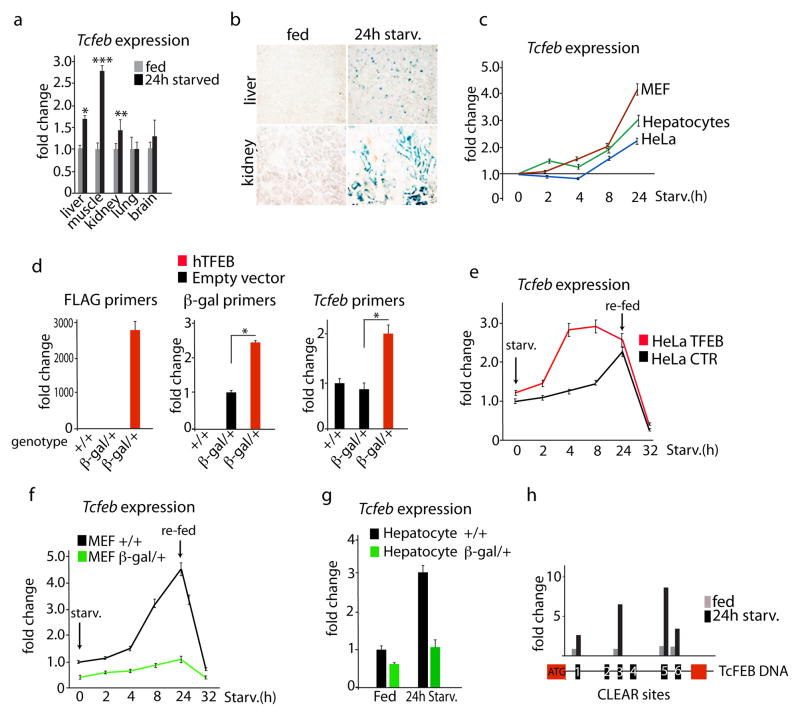
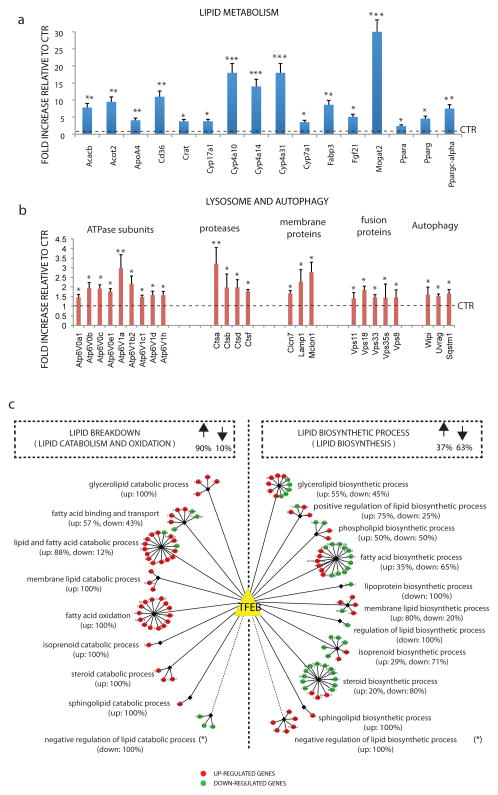
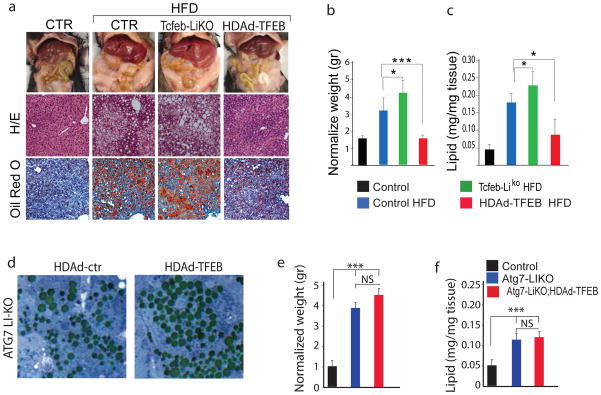
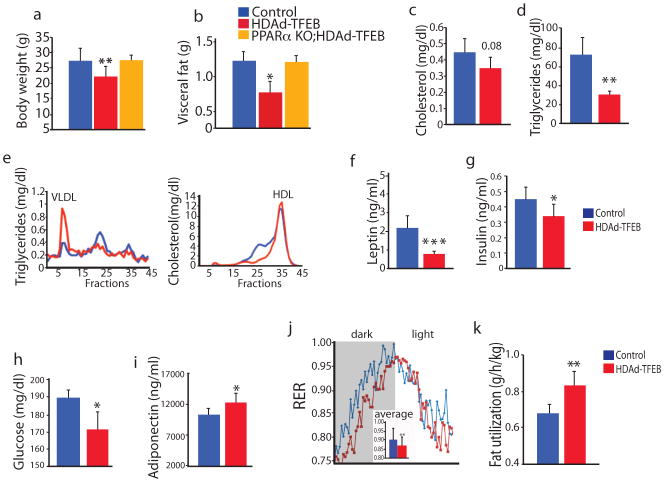
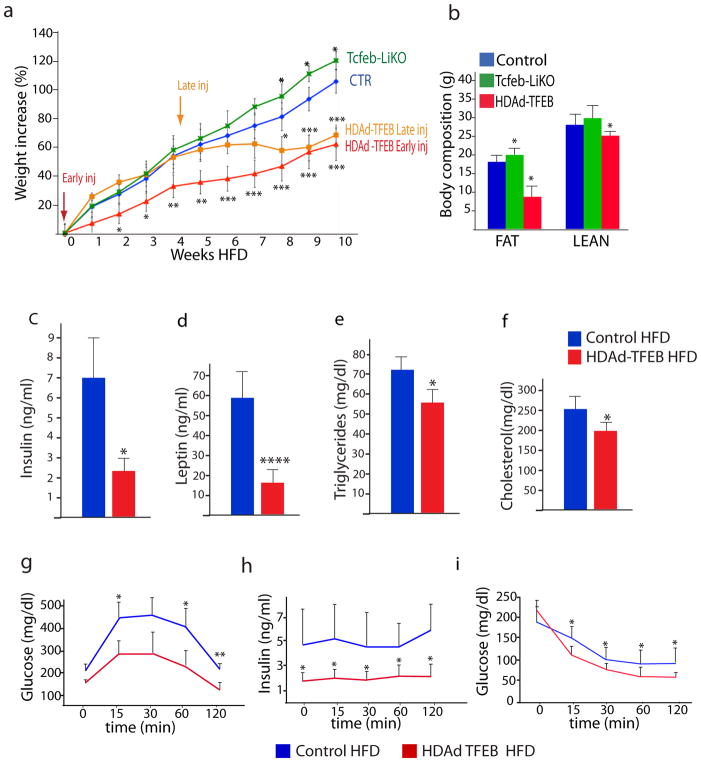
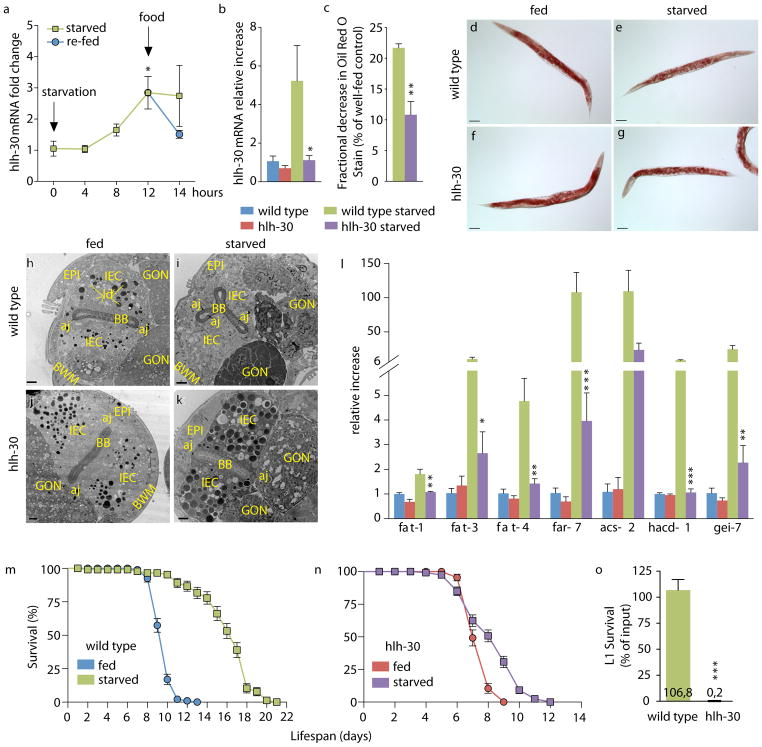
The lysosomal-autophagic pathway is activated by starvation and plays an important role in both cellular clearance and lipid catabolism. However, the transcriptional regulation of this pathway in response to metabolic cues is uncharacterized. Here we show that the transcription factor EB (TFEB), a master regulator of lysosomal biogenesis and autophagy, is induced by starvation through an autoregulatory feedback loop and exerts a global transcriptional control on lipid catabolism via Ppargc1α and Ppar1α. Thus, during starvation a transcriptional mechanism links the autophagic pathway to cellular energy metabolism. The conservation of this mechanism in Caenorhabditis elegans suggests a fundamental role for TFEB in the evolution of the adaptive response to food deprivation. Viral delivery of TFEB to the liver prevented weight gain and metabolic syndrome in both diet-induced and genetic mouse models of obesity, suggesting a new therapeutic strategy for disorders of lipid metabolism.


Conflict of interest statement

The authors declare no competing financial interests. Readers are welcome to comment on the online version of this article at www.nature.com/nature.

Figures

Fig. 1
Fig. 1. Autoregulation of TFEB during starvation
a) Expression levels of Tcfeb mRNA in tissues isolated from 24h-fasted (starv) 6 week old mice. Values are expressed as fold change relative to Tcfeb expression in mice fed ad libitum (fed). Bars represent mean±s.d. for n=5; *P≤0.05; **P≤0.01; ***P≤0.001. b) Representative β-gal staining of liver and kidney frozen sections isolated from fed and 24h–fasted heterozygous Tcfeb-β-gal mice. c) Time-course expression analysis of TFEB in wild-type HeLa cells, MEFs and hepatocytes after addition of starvation media (time 0). Bars represent mean±s.d. for n=3 independent experiments. d) Expression levels of transfected hTFEB-Flag, Tcfeb-β-gal fusion transcript and endogenous Tcfeb mRNAs in MEFs isolated from control (+/+) and heterozygous Tcfeb-β-gal/+ mice. Bars represent mean±s.d. for n=3 e) Time-course expression analysis of TFEB mRNA in control or TFEB-overexpressing HeLa cells during fasting and re-feeding. Primers specific for the endogenous TFEB were used. Bars represent mean±s.d. for n=3 f) Time-course expression analysis of Tcfeb mRNA in heterozygous Tcfeb-β-gal/+ or control MEFs during fasting and re-feeding. Specific primers for the endogenous Tcfeb were used. Bars represent mean±s.d. for n=3 g) Expression analysis of Tcfeb mRNA in heterozygous Tcfeb-β-gal/+ or control hepatocytes in fed and after 24h fasting. Bars represent mean±s.d. for n=3 h) Chromatin immunoprecipitation (ChIP) analysis from liver of mice fed ad libitum or 24h-fasted. The CLEAR elements in the first intron of Tcfeb genomic DNA are shown as numbered black boxes as indicated in Supplementary Table 1. Red boxes represent exons, and the ATG indicates the first codon (from the mouse Tcfeb isoform b). The histogram shows the amount of immunoprecipitated DNA as detected by qPCR assay. Values were normalized to the input and plotted as relative enrichment over a mock control. Data represent mean ± s.d of three independent experiments.
Fig. 2
Fig. 2. The TFEB lipid metabolism network
a, b) mRNA levels of the indicated genes involved in (a) lipid metabolism and in (b) autophagy and lysosome pathway were quantified by qRT–PCR in total RNA isolated from liver samples of mice infected with HDAd-TFEB virus. GAPDH was used as a control. Values are mean± s.d for n=3 and are expressed as fold increase compared to control mice (injected with transgeneless viral vector). * p<0.05; **<0.01. Control levels are indicated by dashed line. c) The 124 genes with a known role in the lipid metabolic process, whose expression was perturbed by TFEB overexpression, are represented as coloured circles and assigned to specific lipid breakdown (left) or lipid biosynthesis (right) sub-categories. The percentages of up-regulated (red circles) and down-regulated genes (green circles) are shown both for the two main groups and for each sub-category. *Note that in calculating these percentages genes assigned to the “negative” regulation of lipid catabolic process and to the “negative” regulation of lipid biosynthetic process have been included in the lipid breakdown and in the lipid biosynthesis groups, respectively.
Fig. 3
Fig. 3. TFEB directly regulates PGC1α expression during starvation
a) Chromatin immunoprecipitation (ChIP) analysis from liver of mice fed ad libitum (fed) or 24h-fasted (starved). CLEAR sites in the promoter region of PGC1α are indicated by boxes. Numbers indicate the distance (bp) of the binding element from the start codon. Bar graphs show the amount of immunoprecipitated DNA as detected by qPCR assay. Values were normalized to the input and plotted as relative enrichment over a mock control. Bar graphs represent mean ± s.d of 3 independent experiments *P≤0.05; **P≤0.01. b) Representative diagrams of the constructs containing the promoter region of PGC1α with either intact (PGC1α WT) or deleted (PGC1α DEL) CLEAR elements upstream of the luciferase cDNA. c) Luciferase activity was measured after transfecting increasing amounts of TFEB-Flag in combination with PGC1α WT or PGC1α DEL plasmids. Bar graphs represent mean ± s.d. of n=3 independent experiments *P≤0.05; **P≤0.01; ****P≤0.0001 compared to mock transfected cells.d) Luciferase activity was measured in cells stably overexpressing TFEB cultured in normal and starved media. Bar graphs represent mean ± s.d. of n=3 independent experiments *P≤0.05; **P≤0.01; ****P≤0.0001 compared to mock transfected cells. e) Quantification of mRNA levels of PGC1α in liver and hepatocytes from control, HDAd-TFEB and Tcfeb-LIKO mice treated as indicated. Bar graphs show mean ±s.d. for n=4. *P≤0.05; **P≤0.01; ***P≤0.001. f) Expression analysis of TFEB target genes in liver of mice with indicated genotypes. Bar graphs show mean ±s.d. for n=3. *P≤0.05; **P≤0.01; ***P≤0.001. g) Expression analysis of PGC1α/PPARα target genes in liver from either fasted or fed mice with indicated genotypes. Bar graphs show mean ±s.d. for n=4. *P≤0.05; **P≤0.01; ***P≤0.001 compared to the respective controls (fed or fasted).
Fig. 4
Fig. 4. Liver fat catabolism in response to starvation is regulated by TFEB
a) Oil red O staining of liver sections isolated from mice with the indicated genotype fed ad libitum and 24h-fasted. Original magnication 40X. b) Toluidin blue staining of liver sections isolated from fed and 24-h–fasted Tcfeb-LiKO and control mice (Tcfeb flox/flox mice). Arrows indicate lipid droplets. Original magnication 100x. c) Bar graphs show the quantification of the number of lipid droplets/hepatocyte from electron microscopy analysis. Representative image is showed on the right. Values are mean±s.d. of at least 10 cell/mice (n=3 mice/group). *P≤0.05; ***P≤0.001 d) Oxygen consumption rate in primary hepatocytes isolated from control and Tcfeb-LiKO mice was measured with an XF24 analyzer (Seahorse) prior and after addition of palmitic acid (0.2 mM) conjugated with BSA. The vertical red line indicates the time at which palmitate was added to cells. Values are mean±s.d. for 3 independent experiments *P≤0.05. e) Total FFA and f) glycerol in the serum isolated from 6h fasted Tcfeb-LiKO and control mice. Values are mean ± s.d. (n= 5) *P≤0.05; **P≤0.01; ****P≤0.0001 compared to controls. g) Total serum ketones in fed and fasted Tcfeb-LiKO and control mice. Bars are mean±s.d. for n=10. *P≤0.05; **P≤0.01 compared to fed control mice. h) EchoMRI measurement of fat and lean mass in fed and in 24-h and 48-h fasted mice expressed as relative % to fed (100% in the graph). Indicated values are mean±s.d. for n=5. *P≤0.05; **P≤0.01 compared to fed control mice. i) Visceral fat pad mass isolated from 2-month-old-mice with indicated genotypes. Indicated values are mean± s.d. for n=5. *P≤0.05; compared to fed control mice.
Fig. 5
Fig. 5. TFEB regulates lipid catabolism through the autophagic pathway
a) Mice with indicated genotype were kept on a high-fat diet for 12 weeks when indicated (HFD). Gross liver morphology (upper panel), H/E (middle panel), and oil red O staining of liver sections (bottom panel). b) Bar graph shows normalized liver weights (mean±s.d. for n=10) and c) total lipid content in mice with indicated genotype (mean±s.d. for n=10). *P≤0.05; **P≤0.01; ***P≤0.001 compared to control. d) Toluidin blue staining of liver sections isolated from ATG7KO mice injected with HDAd-ctr or HDAd-TFEB vector. e) Bar graph shows normalized liver weights (mean±s.d. for n=10 ***P≤0.001) and f) total lipid content in mice with indicated genotype (mean±s.d. for n=5; ***P≤0.001). Mice injected with an empty HDAd virus behaved as wild-type untreated mice, therefore data is not represented in the figure.
Fig. 6
Fig. 6. Metabolic profile of HDAd-TFEB overexpressing mice
(a) Body weight and (b) visceral fat mass isolated from 2-month-old-mice with the indicated genotypes. n=5. (c–i) Serum metabolic profile in HDad-TFEB mice compared to control mice. (j) Respiratory exchange ratio (RER; VCO2/VO2) and (k) fatty acid utilization calculated from data in (j). Values are mean ± s.d (n = 10) *P_0.05; **P_0.01; compared to controls.
Fig. 7
Fig. 7. TFEB prevents diet-induced obesity and metabolic syndrome
a) Body weight curves of male mice fed with HFD (40% calories from fat) for 10 weeks starting from 5 weeks of age (0 on the x axes). Mice were injected with HDAd-TFEB either 1week before (early inj.), or 4 weeks after, (late inj.) being placed on the HFD, as indicated by the arrows. Values are represented as percentages of weight increase. b) Whole body composition analysis (Echo MRI) of the same mice as in (a) after 10 weeks of HFD. In a and b n=10 mice/group; bars represent mean±s.d. *P≤0.05; **P≤0.01; ***P≤0.001 compared to control HFD group. c–f) Total serum insulin, leptin, triglyceride and cholesterol levels in control and HDAd-TFEB mice kept on high-fat diet (HFD) for 10 weeks. Value are mean ±s.d. n=10. *P≤0.05; ****P≤0.0001 compared to control. g–i) Glucose and insulin tolerance tests in control and HDAd-TFEB mice challenged with HFD for 10 weeks. (g) Glucose and (h) serum insulin levels at the indicated time points after glucose challenge. (i) Glucose levels at the indicated time points after insulin challenge. In g,h,i value are mean ±s.d. n=7 mice/group; *P≤0.05; **P≤0.01; ***P≤0.001 compared to control. Mice injected with an empty HDAd virus behaved as wild-type untreated mice, therefore data is not represented in the figure.
Fig. 8
Fig. 8. Conservation of TFEB-mediated autoregulation and of starvation response in C. elegans.
a) hlh-30 qRT-PCR showing increased expression of C. elegans TFEB gene hlh-30 over a time course of starvation in wild type animals followed by a rapid decrease to basal level following re-feeding of the animals ( mean ± s.e.m. of n=3). *P ≤ 0.05 (t test, compared with wild type at t = 0 h). b) hlh-30 3′ UTR qRT-PCR showing expression of hlh-30 after 12 h starvation in wild type and hlh-30(tm1978) animals (mean ± s.e.m. of n=3). *P ≤ 0.05 (t test, compared with wild type starved). c) Quantification of oil red O stain in starved animals relative to well-fed counterparts (mean ± s.e.m. of n=3).**P ≤ 0.01 (t test, compared with wild type starved). d–g) Representative micrographs of wild type and hlh-30 animals after 8 h starvation and stained with oil red O. h–k) Representative TEMs of wild type and hlh-30 animals after 24 h starvation. IEC, intestinal epithelial cell; EPI, epidermis; BB, brush border; GON, gonad; BWM, body wall muscles, aj, apical junction; ld, lipid droplet. Scale bar is 2 μm. l) qRT-PCR of starvation-induced genes in wild type and hlh-30 animals after 12 h starvation (means ± s.e.m of n=3). *P ≤ 0.05; **P ≤ 0.01; ***P ≤ 0.001 (t test, compared with wild type starved). m–n) hlh-30 is required for starvation-induced lifespan extension. One representative experiment of two independent trials; error bars represents mean ± s.e.m. Median Survival (MS) (wild type fed) = 10 d; MS (wild type starved) = 17 d, P < 0.0001 vs fed using the Log-rank test; MS (hlh-30 fed) = 7 d; MS (hlh-30 starved) = 9 d, P < 0.0001 vs fed. o) L1 arrest assay showing survival of wild-type and hlh-30 starved animals relative to non-starved conditions (mean ± s.e.m. of n=3). ***P ≤ 0.001 (t test, compared with wild type starved).

Comment in

References

    1. Bauer M, et al. Starvation response in mouse liver shows strong correlation with lifespan-prolonging processes. Physiol Genomics. 2004;17:230–244. - PubMed
    1. Sokolovic M, et al. The transcriptomic signature of fasting murine liver. BMC Genomics. 2008;9:528. - PMC - PubMed
    1. Hakvoort TB, et al. Interorgan coordination of the murine adaptive response to fasting. J Biol Chem. 2011;286:16332–16343. - PMC - PubMed
    1. Finn PF, Dice JF. Proteolytic and lipolytic responses to starvation. Nutrition. 2006;22:830–844. - PubMed
    1. Fontana L, Partridge L, Longo VD. Extending healthy life span--from yeast to humans. Science. 2010;328:321–326. - PMC - PubMed

Publication types

MeSH terms

Substances