

Computational identification of functional introns: high positional conservation of introns that harbor RNA genes
- PMID: 23605046
- PMCID: PMC3675471
- DOI: 10.1093/nar/gkt244
Computational identification of functional introns: high positional conservation of introns that harbor RNA genes
Abstract
An appreciable fraction of introns is thought to have some function, but there is no obvious way to predict which specific intron is likely to be functional. We hypothesize that functional introns experience a different selection regime than non-functional ones and will therefore show distinct evolutionary histories. In particular, we expect functional introns to be more resistant to loss, and that this would be reflected in high conservation of their position with respect to the coding sequence. To test this hypothesis, we focused on introns whose function comes about from microRNAs and snoRNAs that are embedded within their sequence. We built a data set of orthologous genes across 28 eukaryotic species, reconstructed the evolutionary histories of their introns and compared functional introns with the rest of the introns. We found that, indeed, the position of microRNA- and snoRNA-bearing introns is significantly more conserved. In addition, we found that both families of RNA genes settled within introns early during metazoan evolution. We identified several easily computable intronic properties that can be used to detect functional introns in general, thereby suggesting a new strategy to pinpoint non-coding cellular functions.
Figures
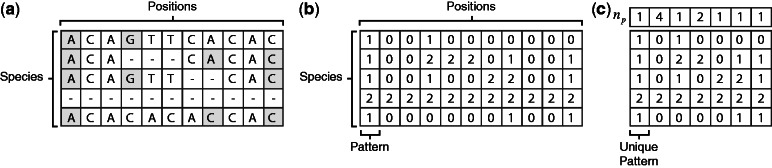
 ).
).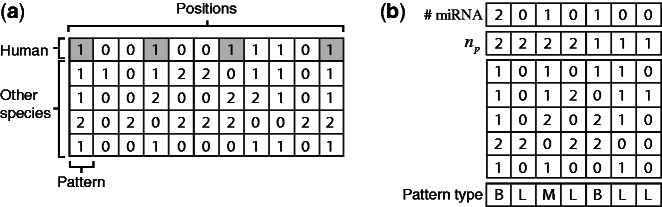
 ), and by the number of times each pattern contains miRNAs in the human intron. The last row specifies the pattern type: ‘B’ for miRNA-bearing, ‘L’ for miRNA-lacking and ‘M’ for miRNA-mixed.
References
-
- Hughes AL, Yeager M. Comparative evolutionary rates of introns and exons in murine rodents. J. Mol. Evol. 1997;45:125–130. - PubMed
-
- Graur D, Li WH. Fundamentals of Molecular Evolution. 2nd edn. Sunderland, MA, USA: Sinauer Associates; 2000.
-
- Rogozin IB, Wolf YI, Sorokin AV, Mirkin BG, Koonin EV. Remarkable interkingdom conservation of intron positions and massive, lineage-specific intron loss and gain in eukaryotic evolution. Curr. Biol. 2003;13:1512–1517. - PubMed
Publication types
MeSH terms
Substances
LinkOut - more resources
Full Text Sources
Other Literature Sources
Molecular Biology Databases
