. 2013 Jul 1;521(10):2208-34.
doi: 10.1002/cne.23273.

Neurochemical characterization of neurons expressing melanin-concentrating hormone receptor 1 in the mouse hypothalamus

Affiliations

Neurochemical characterization of neurons expressing melanin-concentrating hormone receptor 1 in the mouse hypothalamus

Melissa J S Chee et al. J Comp Neurol. .

Abstract

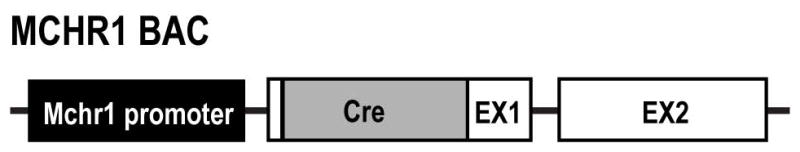
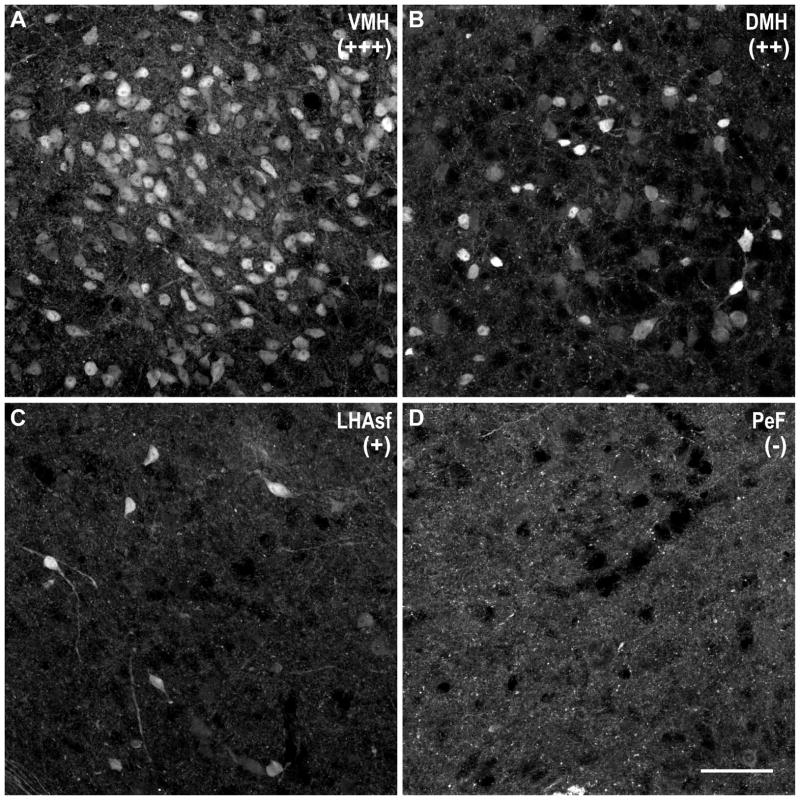
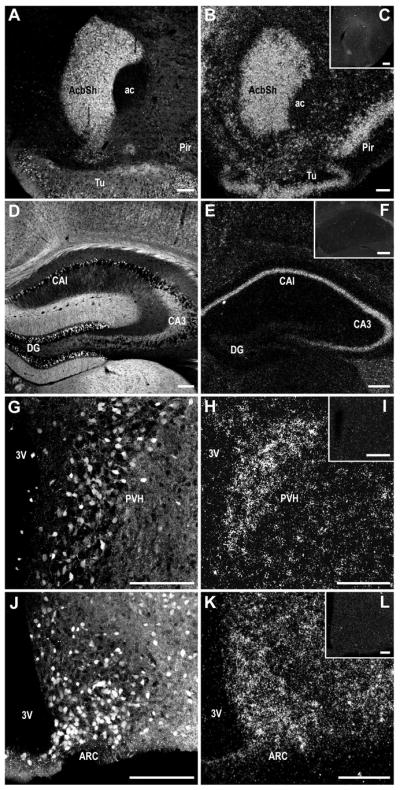
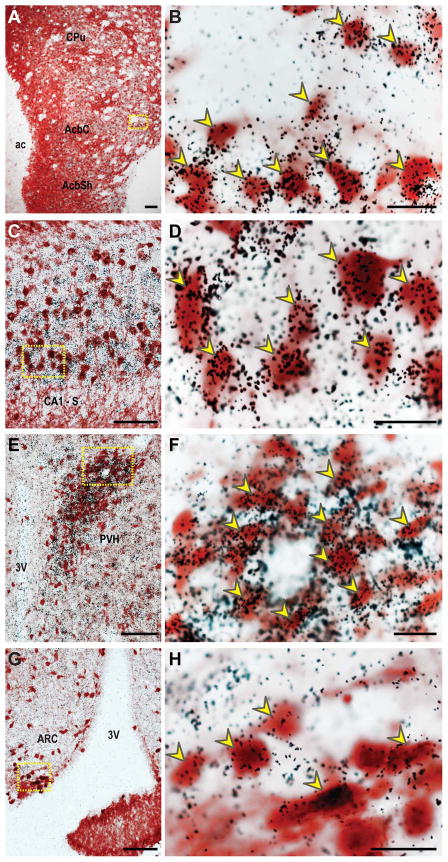
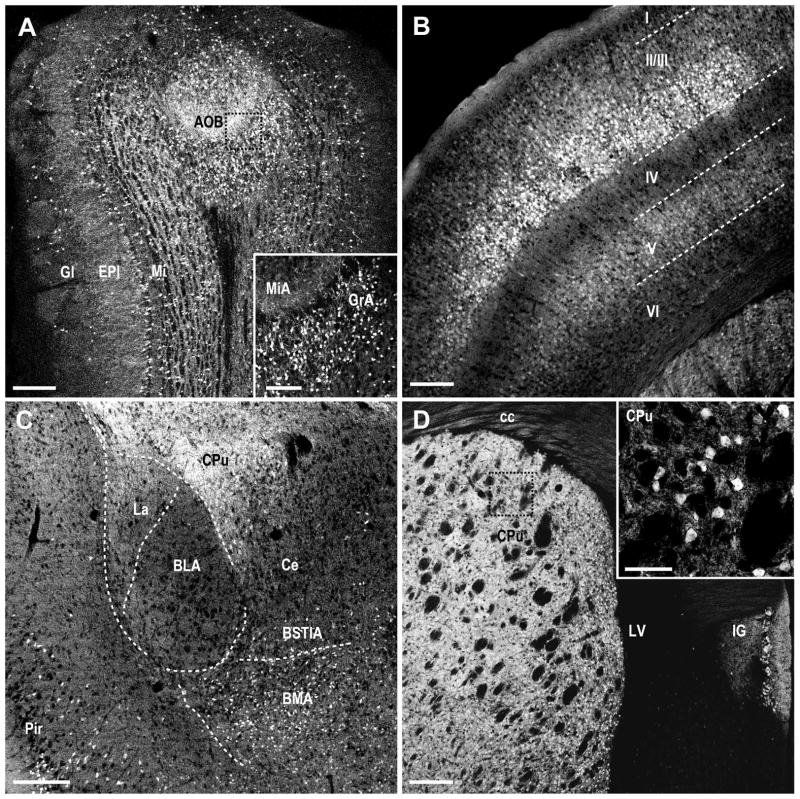
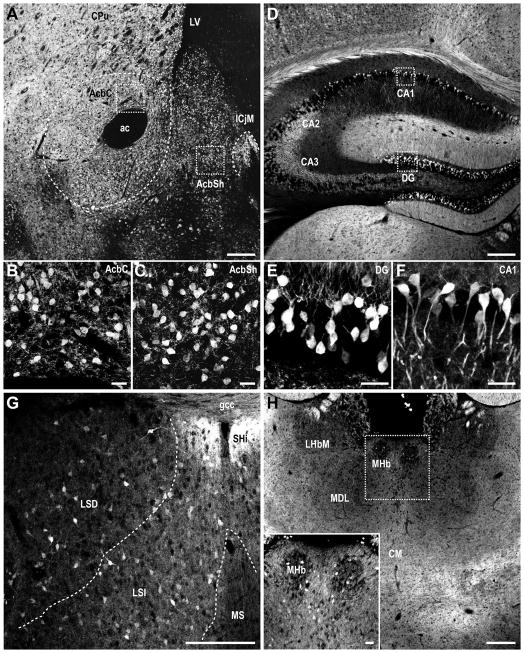
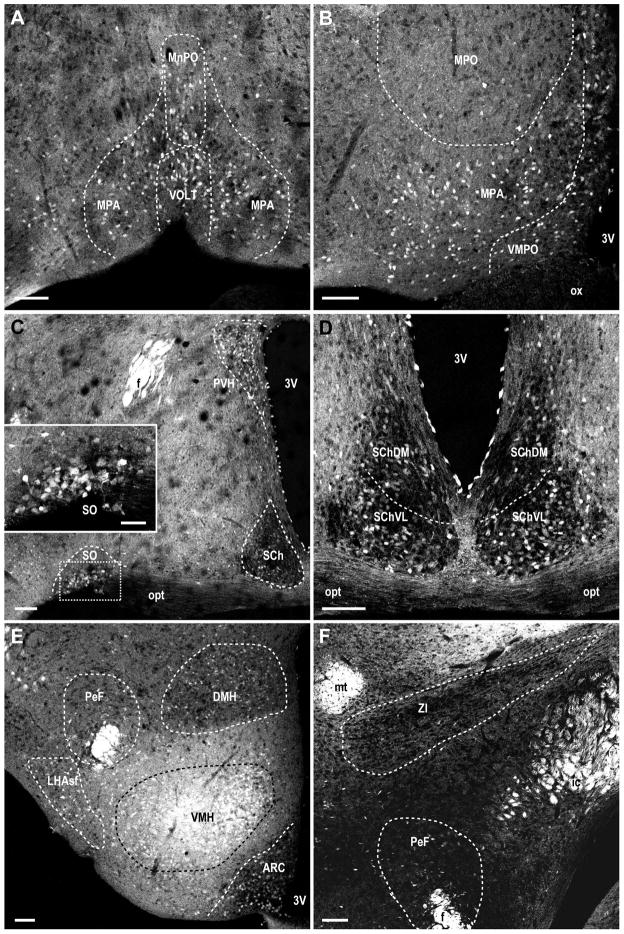
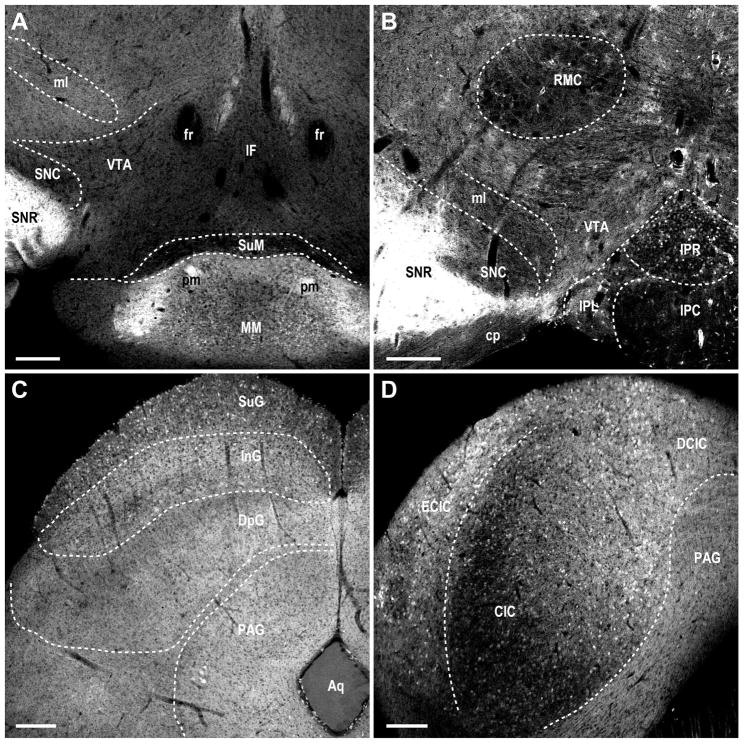
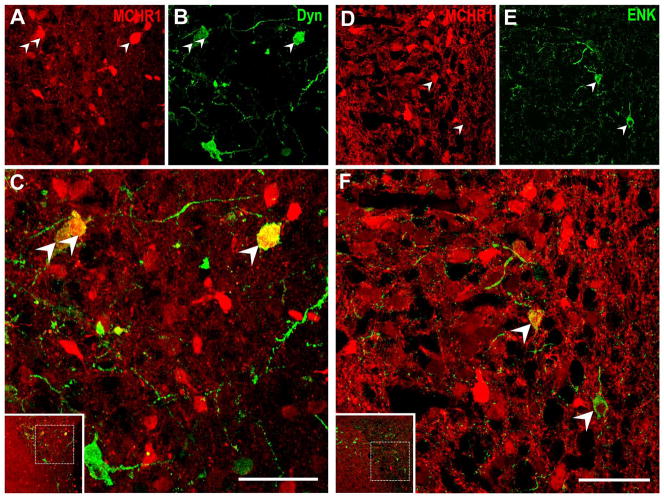
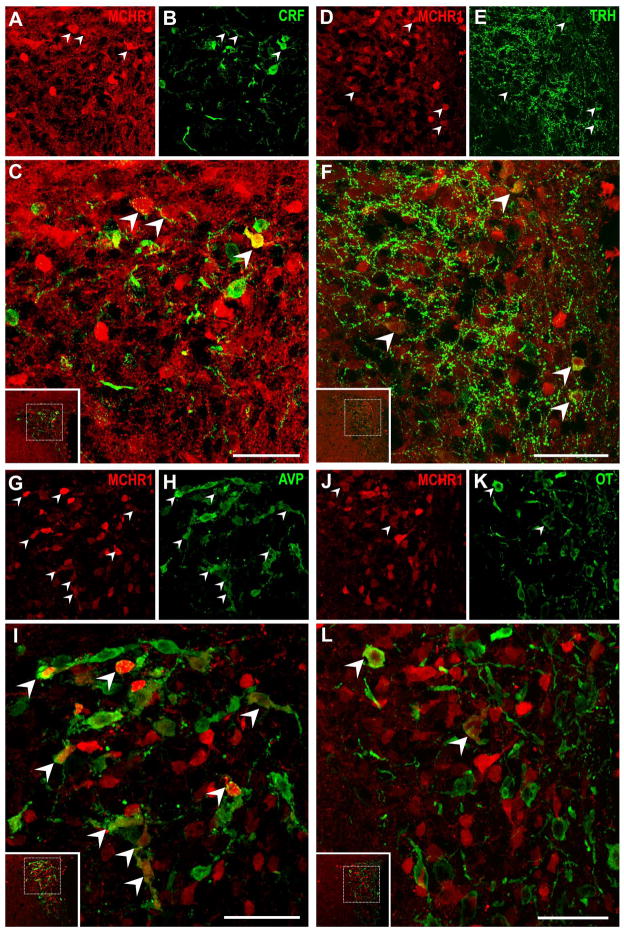
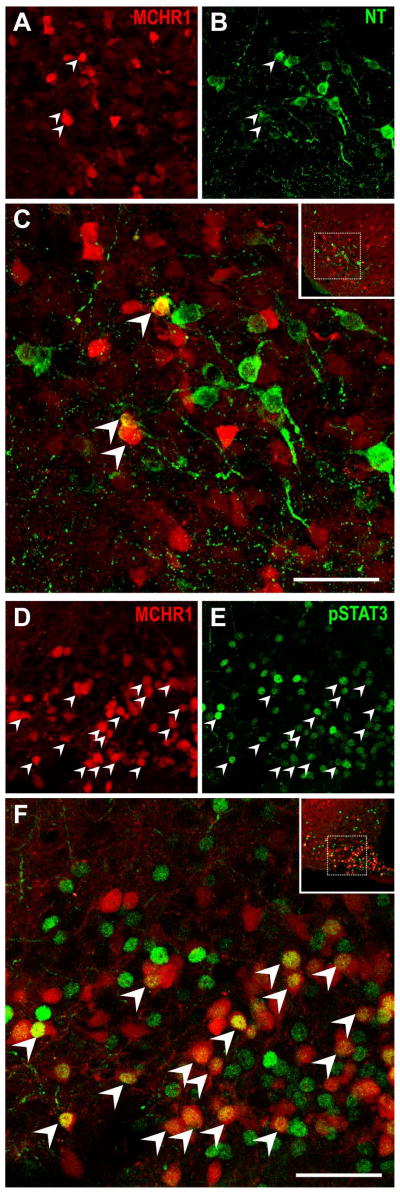
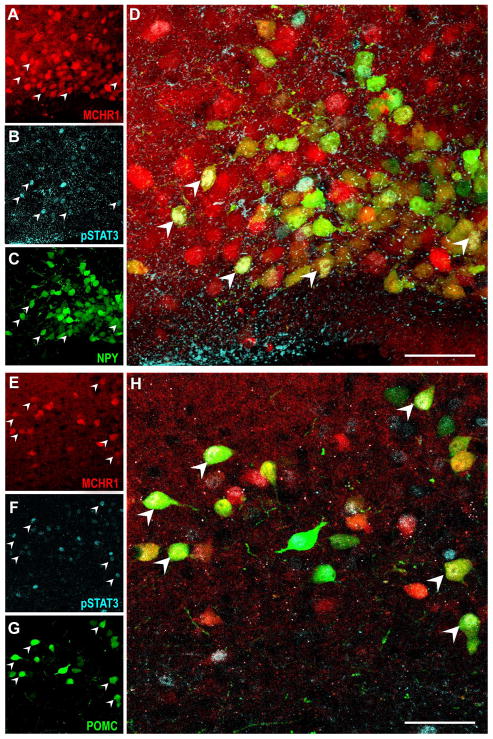
Melanin-concentrating hormone (MCH) is a hypothalamic neuropeptide that acts via MCH receptor 1 (MCHR1) in the mouse. It promotes positive energy balance; thus, mice lacking MCH or MCHR1 are lean, hyperactive, and resistant to diet-induced obesity. Identifying the cellular targets of MCH is an important step to understanding the mechanisms underlying MCH actions. We generated the Mchr1-cre mouse that expresses cre recombinase driven by the MCHR1 promoter and crossed it with a tdTomato reporter mouse. The resulting Mchr1-cre/tdTomato progeny expressed easily detectable tdTomato fluorescence in MCHR1 neurons, which were found throughout the olfactory system, striatum, and hypothalamus. To chemically identify MCH-targeted cell populations that play a role in energy balance, MCHR1 hypothalamic neurons were characterized by colabeling select hypothalamic neuropeptides with tdTomato fluorescence. TdTomato fluorescence colocalized with dynorphin, oxytocin, vasopressin, enkephalin, thyrothropin-releasing hormone, and corticotropin-releasing factor immunoreactive cells in the paraventricular nucleus. In the lateral hypothalamus, neurotensin, but neither orexin nor MCH neurons, expressed tdTomato. In the arcuate nucleus, both Neuropeptide Y and proopiomelanocortin cells expressed tdTomato. We further demonstrated that some of these arcuate neurons were also targets of leptin action. Interestingly, MCHR1 was expressed in the vast majority of leptin-sensitive proopiomelanocortin neurons, highlighting their importance for the orexigenic actions of MCH. Taken together, this study supports the use of the Mchr1-cre mouse for outlining the neuroanatomical distribution and neurochemical phenotype of MCHR1 neurons.


Conflict of interest statement

CONFLICT OF INTEREST STATEMENT

The authors have no known or potential conflict of interest to disclose.

Figures

Figure 1
Figure 1. Generation of mice expressing tdTomato selectively in MCHR1-expressing cells
Schematic illustration of the Mchr1-cre construct. Using a BAC clone, the cre sequence was inserted downstream of the Mchr1 promoter, within exon 1 (EX1) of the Mchr1 gene by homologous recombination. The Mchr1 promoter upstream of the Mchr1 EX1 and exon 2 (EX2) coding sequence drives the expression of cre recombinase. This allows cre recombinase to be expressed from MCHR1-containing cells only.
Figure 2
Figure 2. Density of DsRed-immunoreactive cells from the MCHR1-cre/tdTomato mouse brain varies among regions
Representative photomicrographs of DsRed-IR cells exhibiting A, high density (+++) in the ventromedial nucleus (VMH); B, moderate density (++) in the dorsomedial nucleus (DMH); C, low density (+) in the ventral subfornical lateral hypothalamic area (LHAsf); and D, very low or no (−) labeling in the perifornical area (PeF). Scale bar, 50 μm.
Figure 3
Figure 3. Comparison of native tdTomato fluorescence and 35S-labeled MCHR1 mRNA hybridization signals in the most prominent regions of the forebrain
Photomicrographs illustrating the overall similarities in anatomical distribution between native tdTomato fluorescence (A, D, G, J) and 35S-labeled hybridization signal for MCHR1 mRNA (B, E, H, K) observed from the Mchr1-cre/tdTomato mouse brain. Specificity of the 35S-labeled MCHR1 riboprobe was demonstrated by the absence of specific hybridization signals from the respective region of a Mchr1−/− mouse brain (C, F, I, L). 3V, third ventricle; ac, anterior commissure; AcbSh, accumbens nucleus shell; ARC, arcuate nucleus; CA1, field CA1 of hippocampus; CA3, field CA3 of hippocampus; DG, dentate gyrus; Pir, piriform cortex; PVH, paraventricular nucleus of hypothalamus; Tu, olfactory tubercle. Scale bar, 150 μm; 200 μm in inset.
Figure 4
Figure 4. Colocalization of DsRed-immunoreactive cells with 35S-labeled MCHR1 mRNA expression
Representative bright-field photomicrographs illustrating the overlap of DsRed immunoreactive, labeled with a brown precipitate, and MCHR1 mRNA hybridization regions, labeled with clusters of silver grain deposits, in AB, the striatum (~Bregma 1.75); CD, area CA1-subiculum border of the hippocampus (~Bregma −3.40); EF, paraventricular nucleus of the hypothalamus (~Bregma −0.70); GH, arcuate nucleus of the hypothalamus (~Bregma −1.50). High power magnification photomicrographs (B, D, F, H) of the area outlined by dotted yellow line (A, C, E, G, respectively) show individual colocalized labeled cells. Some representative colocalized neurons are indicated by yellow arrowheads. 3V, third ventricle; ac, anterior commissure; AcbC, accumbens nucleus core; AcbSh, accumbens nucleus shell; ARC, arcuate nucleus; CA1, field CA1 of hippocampus; CPu, caudate putamen; PVH, paraventricular nucleus of hypothalamus; S, subiculum. Scale bar, 100 μm in A, C, E, G; 20 μm in B, D, F, H.
Figure 5
Figure 5. MCHR1 expression in the olfactory bulb, neocortex, amygdala, and caudate putamen of the Mchr1-cre/tdTomato mouse brain
Photomicrographs illustrating the distribution of native tdTomato fluorescence in the A, olfactory bulb; B, somatosensory cortex; C, amygdala; D, caudate putamen. I, Layer I of somatosensory cortex (S1); II/III, Layers II/IIII of S1, IV, Layer IV of S1; V, Layer V of S1; VI, Layer VI of S1; AOB, accessory olfactory bulb; BLA, basolateral amygdaloid nucleus, anterior part; BMA, basomedial amygdaloid nucleus, anterior part; BSTIA, bed nucleus of the stria terminalis, intraamygaloid division; cc, corpus callosum; Ce, central amygdaloid nucleus; CPu, caudate putamen; EPl, external plexiform layer of the olfactory bulb; Gl, glomerular layer of the olfactory bulb; GrA, granular cell layer of the accessory olfactory bulb; IG, indusium griseum; La, lateral amygdaloid nucleus; LV, lateral ventricle; Mi, mitral cell layer of the olfactory bulb; MiA, mitral cell layer of the accessory olfactory bulb; Pir, piriform cortex. Scale bar, 200 μm; 50μm in inset.
Figure 6
Figure 6. MCHR1 expression in the striatum, hippocampus, septum, and thalamus of the Mchr1-cre/tdTomato mouse brain
Photomicrographs illustrating the distribution of native tdTomato fluorescence in the AC, striatum; DF, hippocampus; G, septal nucleus; H, thalamus. High magnification photomicrographs of the outlined striatal regions (A) show higher density of MCHR1 neurons in the accumbens nucleus shell (C) than core (B). High magnification photomicrographs of the outlined hippocampal regions (D) show higher density of MCHR1 neurons in the dentate gyrus (E) than field CA1 (F). ac, anterior commissure; AcbC, accumbens nucleus core; AcbSh, accumbens nucleus shell; CA1, field CA1 of hippocampus; CA2, field CA2 of hippocampus; CA3, field CA3 of hippocampus; CM, central medial thalamic nucleus; CPu, caudate puramen; DG, dentate gyrus; gcc, genu corpus callosum; ICjM, major islands of Calleja; IG, indusium griseum; LHbM, lateral habenular nucleus, medial part; LSD, lateral septal nucleus, dorsal part; LSI, lateral septal nucleus, intermediate part; LV, lateral ventricle; MDL, mediodorsal thalamic nucleus; MHb, medial habenular nucleus; MS, medial septal nucleus; SHi, septohippocampal nucleus. Scale bar, 200 μm; 25 μm in inset.
Figure 7
Figure 7. MCHR1 expression in hypothalamic regions of the Mchr1-cre/tdTomato mouse brain
Photomicrographs illustrating the distribution of native tdTomato fluorescence in the A, anterior medial preoptic area and basal forebrain; B, medial preoptic regions; C, supraoptic nucleus, suprachiasmatic nucleus, anterior paraventricular nucleus; D, subdivisions of the suprachiasmatic nucleus; E, dorsomedial hypothalamus, perifornical and ventral subfornical region of the lateral hypothalamus, ventromedial hypothalamus, arcuate nucleus; F, zona incerta and perifornical region of the lateral hypothalamus. 3V, third ventricle; DMH, dorsomedial nucleus of hypothalamus; f, fornix; ic, internal capsule; LHAsf, ventral subfornical lateral hypothalamic area; MPA, medial preoptic area; MPO, medial preoptic nucleus; MnPO, median preoptic nucleus; mt, mammillothalamic tract; opt, optic tract; ox, optic chiasm; PeF, perifornical nucleus; PVH, paraventricular nucleus of hypothalamus; SCh, suprachiasmatic nucleus; SChDM, suprachiasmatic nucleus, dorsomedial part; SChVL, suprachiasmatic nucleus, ventrolateral part; SO, supraoptic nucleus; VMH, ventromedial nucleus of hypothalamus; VMPO, ventromedial preoptic area; VOLT, vascular organ of the lamina terminalis; ZI, zona incerta. Scale bar, 100μm; 50 μm in inset.
Figure 8
Figure 8. MCHR1 expression in the midbrain of the Mchr1-cre/tdTomato mouse brain
Photomicrographs illustrating the distribution of native tdTomato fluorescence in the A, mammilary nucleus; B, interpeduncular nucleus; C, superior colliculus; D, inferior colliculus. Photomicrographs also demonstrate the absence of fluorescently labeled cells in the substantia nigra (AB), ventral tegmental area (AB), interfascicular nucleus (A), red nucleus (B), and periaqueductal gray (CD). Aq, aqueduct; CIC, central nucleus of the inferior colliculus; cp, cerebral peduncle; DCIC, dorsal cortex of the inferior colliculus; DpG, deep gray layer of the superior colliculus; ECIC, external cortex of the inferior colliculus; fr, fasciculus retroflexus; IF, interfascicular nucleus; InG, intermediate gray layer of the superior colliculus; IPC, interpeducular nucleus, caudal subnucleus; IPL, interpeduncular nucleus, lateral subnucleus; IPR, interpeduncular nucleus, rostral subnucleus; ml, medial lemniscus; MM, medial mammilary nucleus, medial part; PAG, periaqueductal gray; pm, principal mammillary tract; RMC, red nucleus, magnocellular part; SNC, substantia nigra, compact part; SNR, substantia nigra, reticular part; SuG, superficial gray layer of the superior colliculus; SuM supramammilary nucleus; VTA, ventral tegmental area. Scale bar, 200 μm.
Figure 9
Figure 9. MCHR1 expression in the hindbrain and cerebellum of the Mchr1-cre/tdTomato mouse brain
Photomicrographs illustrating the distribution of native tdTomato fluorescence in the A, locus coeruleus and tegmental nucleus; B, area postrema and nucleus of the solitary tract; C, spinal trigeminal nucleus; D, Purkinje cells along the cerebellar lobules. Photomicrographs demonstrate the absence of fluorescently labeled cells in the locus coeruleus, subcoeruleus nucleus, and tegmentum (A). 2–3, cerebellar lobules; 10N, dorsal motor nucleus of vagus; 12N, hypoglossal nucleus; AP, area postrema; CC, central canal; DMTg, dorsomedial tegmental area; DTgC, dorsal tegmental nucleus, central part; LC, locus coeruleus; LDT, laterodorsal tegmental nucleus; mlf, medial longitudinal fasciculus; PnR, pontine raphe nucleus; Sol, nucleus of the solitary tract; Sp5I, spinal trigeminal nucleus, interpolar part; SubCD, subcoeruleus nucleus, dorsal part. Scale bar, 200 μm.
Figure 10
Figure 10. Characterization of MCHR1-expressing neurons in opioidergic neurons within the paraventricular nucleus of the hypothalamus
Representative photomicrographs of two-color confocal images showing that a subpopulation of tdTomato fluorescent neurons in the paraventricular nucleus express immunoreactivity for AC, dynorphin-A; DF, enkephalin. Singly-labeled neurons appear either red or green while coexpression (arrowhead) is indicated by cells appearing yellow due to color overlay in the merged image (C, F). All stainings were performed in Mchr1-cre/tdTomato mouse brains. Inset within merged image panels C, F indicate the relative position of the hypothalamic region imaged. Only a representative sample of coexpressing cells from each panel was marked. Scale bar, 50 μm. Corresponding magenta-green images are provided in Supplemental 1.
Figure 11
Figure 11. Characterization of MCHR1-expressing parvocellular and magnocellular neurons in the paraventricular nucleus of the hypothalamus
Representative photomicrographs of two-color confocal images showing that a subpopulation of tdTomato fluorescent neurons in the paraventricular nucleus express immunoreactivity for AC, corticotropin-releasing factor; DF, thyrothropin-releasing hormone; GI, Arg-vasopressin; JL, oxytocin. Singly-labeled neurons appear either red or green while coexpression (arrowhead) is indicated by cells appearing yellow due to color overlay in the merged image (C, F, I, L). All stainings were performed in Mchr1-cre/tdTomato mouse brains. Inset within merged image panels C, F, I, L indicate the relative position of the hypothalamic region imaged. Only a representative sample of coexpressing cells from each panel was marked. Scale bar, 50 μm. Corresponding magenta-green images are provided in Supplemental 2.
Figure 12
Figure 12. Characterization of MCHR1-expressing neurons in the lateral hypothalamus and arcuate nucleus of the hypothalamus
Representative photomicrographs of two-color confocal images showing that a subpopulation of tdTomato fluorescent neurons express immunoreactivity for AC, neurotensin in the ventral subfornical region of the lateral hypothalamus; DF, phospho-STAT3 in the arcuate nucleus. Singly-labeled neurons appear either red or green while coexpression (arrowhead) is indicated by cells appearing yellow due to color overlay in the merged image (C, F). All stainings were performed in Mchr1-cre/tdTomato mouse brains. Inset within merged image panels C, F indicate the relative position of the hypothalamic region imaged. Only a representative sample of coexpressing cells from each panel was marked. Scale bar, 50 μm. Corresponding magenta-green images are provided in Supplemental 3.
Figure 13
Figure 13. Characterization of leptin-sensitive MCHR1-expressing neurons in the arcuate nucleus of the hypothalamus
Photomicrographs of three-color confocal images showing coexpression of arcuate tdTomato fluorescence (red; A, E), phoshpo-STAT3 (cyan; B, F) and humanized, renilla green fluorescent protein (hrGFP) (green; C, G) with AD, Neuropeptide Y neurons from the Npy-hrGFP; Mchr1-cre/tdTomato mouse brain; EH, proopiomelanocortin neurons from the Pomc-hrGFP; Mchr1-cre/tdTomato mouse brain. Triple labeled neurons (arrowhead) appear white due to color overlay in the merged image (D, H). Scale bar, 50 μm. Corresponding magenta-green-cyan images are provided in Supplemental 4.

References

    1. Abbott CR, Kennedy AR, Wren AM, Rossi M, Murphy KG, Seal LJ, Todd JF, Ghatei MA, Small CJ, Bloom SR. Identification of hypothalamic nuclei involved in the orexigenic effect of melanin-concentrating hormone. Endocrinology. 2003;144:3943–3949. - PubMed
    1. Adams AC, Domouzoglou EM, Chee MJ, Segal-Liebermann G, Pissios P, Maratos-Flier E. Ablation of the hypothalamic neuropeptide melanin concentrating hormone is associated with behavioral abnormalities that reflect impaired olfactory integration. Behav Brain Res. 2011;224:195–200. - PMC - PubMed
    1. Ahima RS, Prabakaran D, Mantzoros C, Qu D, Lowell B, Maratos-Flier E, Flier JS. Role of leptin in the neuroendocrine response to fasting. Nature. 1996;382:250–252. - PubMed
    1. Alon T, Friedman JM. Late-onset leanness in mice with targeted ablation of melanin concentrating hormone neurons. J Neurosci. 2006;26:389–397. - PMC - PubMed
    1. Alon T, Zhou L, Pérez CA, Garfield AS, Friedman JM, Heisler LK. Transgenic mice expressing green fluorescent protein under the control of the corticotropin-releasing hormone promoter. Endocrinology. 2009;150:5626–5632. - PMC - PubMed

Publication types

MeSH terms