

Mathematical model approach to describe tumour response in mice after vaccine administration and its applicability to immune-stimulatory cytokine-based strategies
- PMID: 23605806
- PMCID: PMC3691429
- DOI: 10.1208/s12248-013-9483-5
Mathematical model approach to describe tumour response in mice after vaccine administration and its applicability to immune-stimulatory cytokine-based strategies
Abstract
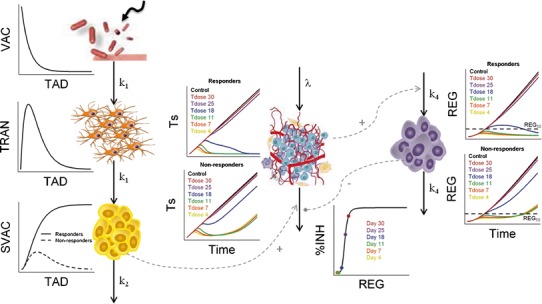
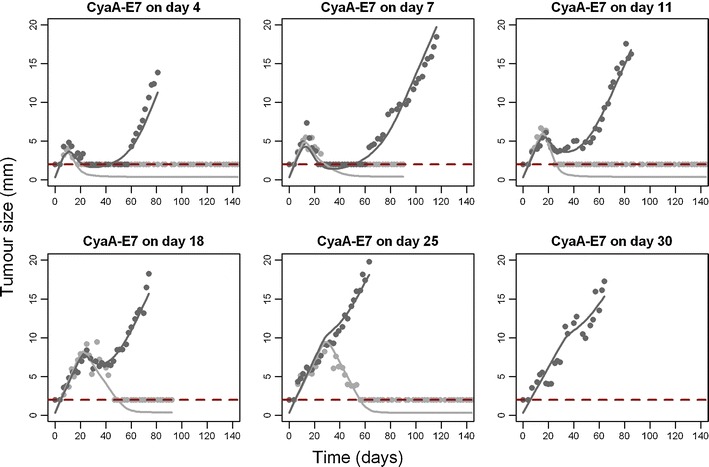
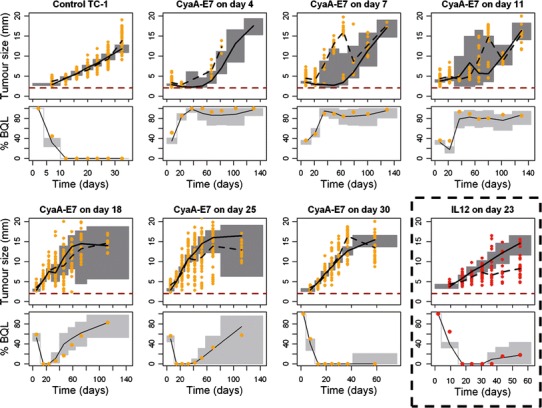
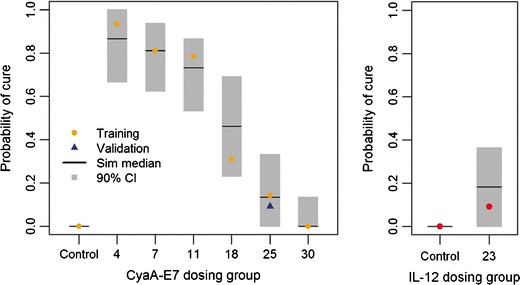
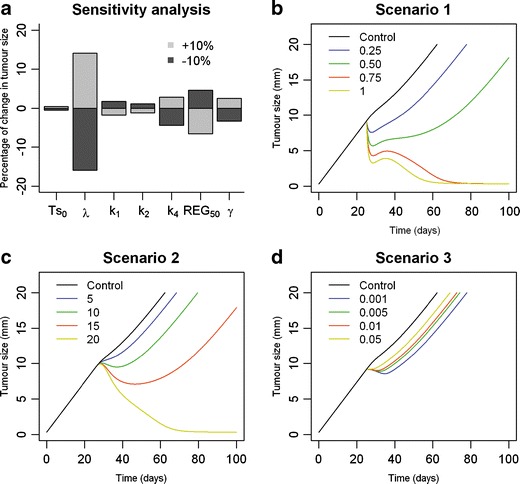
Immunotherapy is a growing therapeutic strategy in oncology based on the stimulation of innate and adaptive immune systems to induce the death of tumour cells. In this paper, we have developed a population semi-mechanistic model able to characterize the mechanisms implied in tumour growth dynamic after the administration of CyaA-E7, a vaccine able to target antigen to dendritic cells, thus triggering a potent immune response. The mathematical model developed presented the following main components: (1) tumour progression in the animals without treatment was described with a linear model, (2) vaccine effects were modelled assuming that vaccine triggers a non-instantaneous immune response inducing cell death. Delayed response was described with a series of two transit compartments, (3) a resistance effect decreasing vaccine efficiency was also incorporated through a regulator compartment dependent upon tumour size, and (4) a mixture model at the level of the elimination of the induced signal vaccine (k 2) to model tumour relapse after treatment, observed in a small percentage of animals (15.6%). The proposed model structure was successfully applied to describe antitumor effect of IL-12, suggesting its applicability to different immune-stimulatory therapies. In addition, a simulation exercise to evaluate in silico the impact on tumour size of possible combination therapies has been shown. This type of mathematical approaches may be helpful to maximize the information obtained from experiments in mice, reducing the number of animals and the cost of developing new antitumor immunotherapies.
Figures

Similar articles
-
Phenotypic profile of dendritic and T cells in the lymph node of Balb/C mice with breast cancer submitted to dendritic cells immunotherapy.Immunol Lett. 2016 Sep;177:25-37. doi: 10.1016/j.imlet.2016.07.009. Epub 2016 Jul 14. Immunol Lett. 2016. PMID: 27423825
-
Cancer-associated fibroblast-targeted strategy enhances antitumor immune responses in dendritic cell-based vaccine.Cancer Sci. 2015 Feb;106(2):134-42. doi: 10.1111/cas.12584. Epub 2015 Jan 16. Cancer Sci. 2015. PMID: 25483888 Free PMC article.
-
Engineered outer membrane vesicle is potent to elicit HPV16E7-specific cellular immunity in a mouse model of TC-1 graft tumor.Int J Nanomedicine. 2017 Sep 12;12:6813-6825. doi: 10.2147/IJN.S143264. eCollection 2017. Int J Nanomedicine. 2017. PMID: 28979120 Free PMC article.
-
The role of regulatory T lymphocytes in the induced immune response mediated by biological vaccines.Immunobiology. 2006;211(1-2):127-36. doi: 10.1016/j.imbio.2005.11.003. Epub 2006 Jan 4. Immunobiology. 2006. PMID: 16446177 Review.
-
Cellular vaccine therapy for cancer.Expert Rev Vaccines. 2002 Oct;1(3):303-16. doi: 10.1586/14760584.1.3.303. Expert Rev Vaccines. 2002. PMID: 12901571 Review.
Cited by
-
Multivariate analysis of cytokine profiles in pregnancy complications.Am J Reprod Immunol. 2018 Mar;79(3):e12818. doi: 10.1111/aji.12818. Epub 2018 Feb 15. Am J Reprod Immunol. 2018. PMID: 29450942 Free PMC article.
-
Optimizing the Efficacy of Vaccine-Induced Immunotherapy in Melanomas.bioRxiv [Preprint]. 2025 Jan 8:2025.01.06.631283. doi: 10.1101/2025.01.06.631283. bioRxiv. 2025. Update in: Bull Math Biol. 2025 May 28;87(7):86. doi: 10.1007/s11538-025-01462-w. PMID: 39829889 Free PMC article. Updated. Preprint.
-
Modulation of intratumoural myeloid cells, the hallmark of the anti-tumour efficacy induced by a triple combination: tumour-associated peptide, TLR-3 ligand and α-PD-1.Br J Cancer. 2021 Mar;124(7):1275-1285. doi: 10.1038/s41416-020-01239-z. Epub 2021 Feb 3. Br J Cancer. 2021. PMID: 33531689 Free PMC article.
-
Radiation and PD-(L)1 treatment combinations: immune response and dose optimization via a predictive systems model.J Immunother Cancer. 2018 Feb 27;6(1):17. doi: 10.1186/s40425-018-0327-9. J Immunother Cancer. 2018. PMID: 29486799 Free PMC article.
-
The Role of Mathematical Models in Immuno-Oncology: Challenges and Future Perspectives.Pharmaceutics. 2021 Jul 2;13(7):1016. doi: 10.3390/pharmaceutics13071016. Pharmaceutics. 2021. PMID: 34371708 Free PMC article. Review.
References
Publication types
MeSH terms
Substances
LinkOut - more resources
Full Text Sources
Other Literature Sources
Molecular Biology Databases
