

Survival rates and prognostic factors for infiltrating salivary duct carcinoma: Analysis of 228 cases from the Surveillance, Epidemiology, and End Results database
- PMID: 23606370
- PMCID: PMC4524549
- DOI: 10.1002/hed.23350
Survival rates and prognostic factors for infiltrating salivary duct carcinoma: Analysis of 228 cases from the Surveillance, Epidemiology, and End Results database
Abstract
Background: The survival rates and prognostic factors for salivary duct carcinoma (SDC) are not clear.
Methods: Survival estimates and prognostic factors were evaluated for 228 patients with SDC identified from the Surveillance, Epidemiology, and End Results (SEER) database.
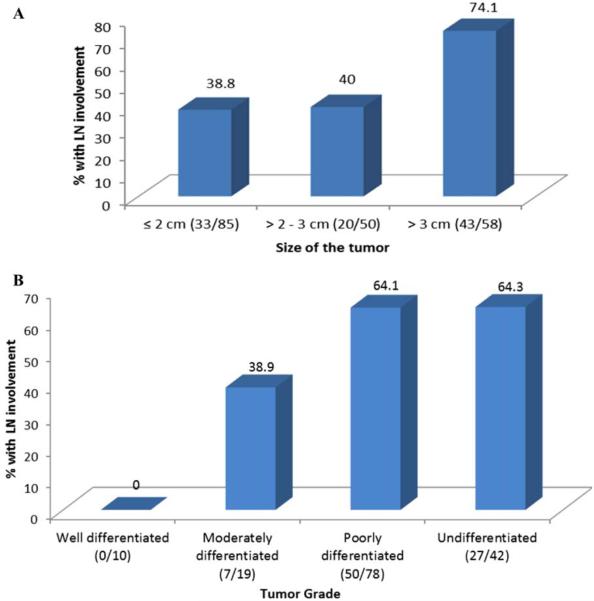
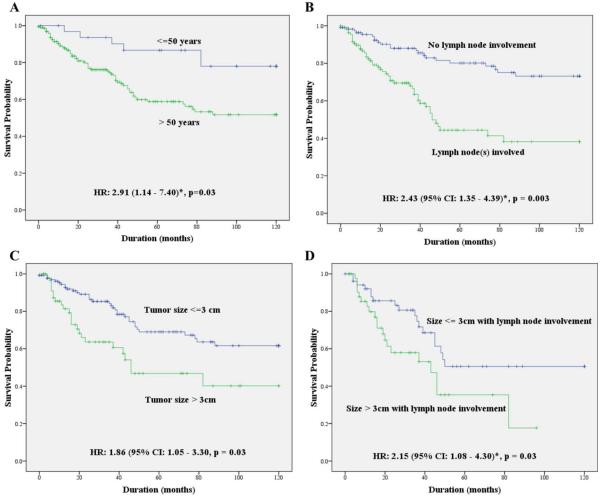
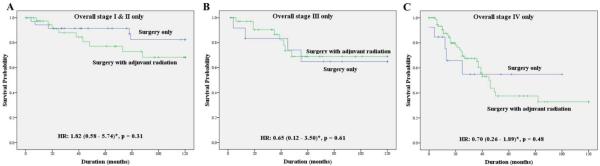
Results: Median overall survival (OS) duration for patients with SDC was 79 months and 5-year disease-specific survival (DSS) rate was 64%. Among patients with SDC with lymph node involvement, larger primary tumor size (>3 cm) was associated with twice the risk of death (p < .03). Factors predictive of improved DSS were age (p = .01), tumor size (p = .006), tumor grade (p = .02), and lymph node involvement (p < .001). Adjuvant radiotherapy did not improve survival when compared to surgery alone for early-stage (I-II) disease (p = .28).
Conclusion: Younger patients with SDC (<50 years) showed a better prognosis. Primary tumor size and lymph node involvement were independent and additive risk factors for poor prognosis. The role of adjuvant radiotherapy in the treatment of SDC needs to be explored further.
Keywords: SEER; prognostic factors; radiation; salivary duct carcinoma; survival rates.
Copyright © 2013 Wiley Periodicals, Inc.
Figures
References
-
- Barnes L, Eveson JW, Reichart P, Sidaransky D, editors. Pathology and Genetics of Head and Neck Tumours. IARC Press; Lyon, France: 2005. World Health Organization Classification of Tumours.
-
- Guzzo M, Di Palma S, Grandi C, Molinari R. Salivary duct carcinoma: clinical characteristics and treatment strategies. Head Neck. 1997;19:126–133. - PubMed
-
- Barnes L, Rao U, Krause J, Contis L, Schwartz A, Scalamogna P. Salivary duct carcinoma. Part I. A clinicopathologic evaluation and DNA image analysis of 13 cases with review of the literature. Oral Surg Oral Med Oral Pathol. 1994;78:64–73. - PubMed
-
- Epivatianos A, Dimitrakopoulos J, Trigonidis G. Intraoral salivary duct carcinoma: a clinicopathological study of four cases and review of the literature. Ann Dent. 1995;54:36–40. - PubMed
-
- Ferlito A, Gale N, Hvala H. Laryngeal salivary duct carcinoma: a light and electron microscopic study. J Laryngol Otol. 1981;95:731–738. - PubMed
MeSH terms
Grants and funding
LinkOut - more resources
Full Text Sources
Other Literature Sources
Medical
