

Review
doi: 10.1002/nbm.2948.
Epub 2013 Apr 22.
In vivo MRI cell tracking using perfluorocarbon probes and fluorine-19 detection
Affiliations
- PMID: 23606473
- PMCID: PMC3893103
- DOI: 10.1002/nbm.2948
Item in Clipboard
Review
In vivo MRI cell tracking using perfluorocarbon probes and fluorine-19 detection
NMR Biomed.
2013 Jul.
Abstract
This article presents a brief review of preclinical in vivo cell-tracking methods and applications using perfluorocarbon (PFC) probes and fluorine-19 ((19) F) MRI detection. Detection of the (19) F signal offers high cell specificity and quantification ability in spin density-weighted MR images. We discuss the compositions of matter, methods and applications of PFC-based cell tracking using ex vivo and in situ PFC labeling in preclinical studies of inflammation and cellular therapeutics. We also address the potential applicability of (19) F cell tracking to clinical trials.
Copyright © 2013 John Wiley & Sons, Ltd.
Figures
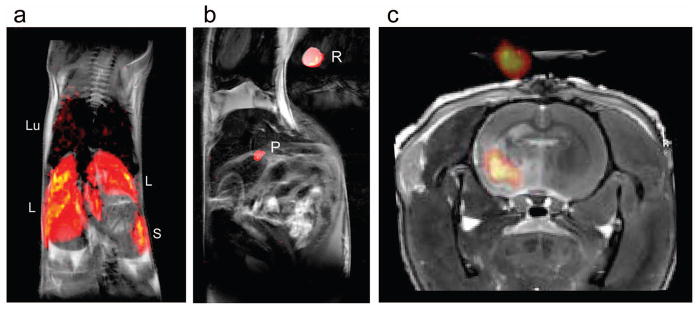
In vivo cytometry examples using ex vivo PFC labeled cells in rodent models. 19F images of the labeled cells are displayed on a ‘hot-iron’ intensity scale, and the anatomical (1H) images are shown in grayscale. (a) Composite image through the torso following intravenous inoculation with labeled DCs. Cells are apparent in the liver, spleen, and weakly in the lungs (36). (b) Adoptively transferred T cells selectively home to the pancreas in a pre-diabetic mouse model. Activated T cells bearing receptors specific for an islet antigen were PFC labeled and then transferred (5×10⁶ cells) into an NOD SCID mouse (1). The image shows T cells (pseudo-color) homing to the pancreas (P). (c) Neuronal stem cells injected into the infarct of a rat stroke model (33). A 19F reference capillary is outside the brain.
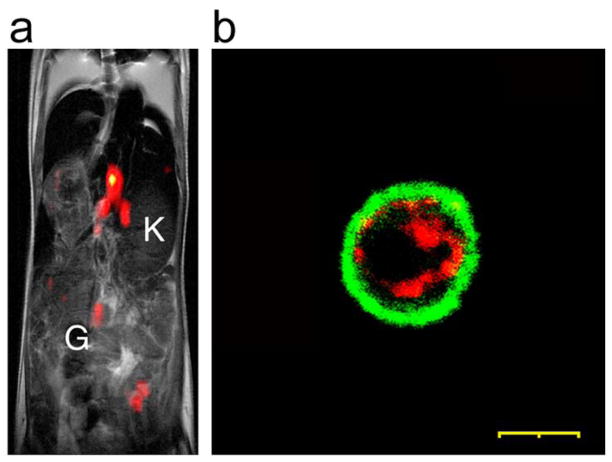
Dual-mode 19F MRI-fluorescent PFC emulsion (19). (a) Shows CD4+ T cells from a wild-type DBA mouse, labeled ex vivo, and infused back into a recipient of the same strain. The in vivo19F image (pseudo-color) through the torso shows a localized accumulation of T cells in periaortic lymph nodes. The 1H image is in grayscale, and the kidneys (K) and gut (G) are noted. (b) Fluorescence microscopy shows intracytoplasmic localization of PFC-dye (BODIPy, red) in mouse T cells, where the nucleus is blue (Hoechst dye) and the cell surface is stained with CD4- FITC antibody (green). (Scale bar is 20 μm)
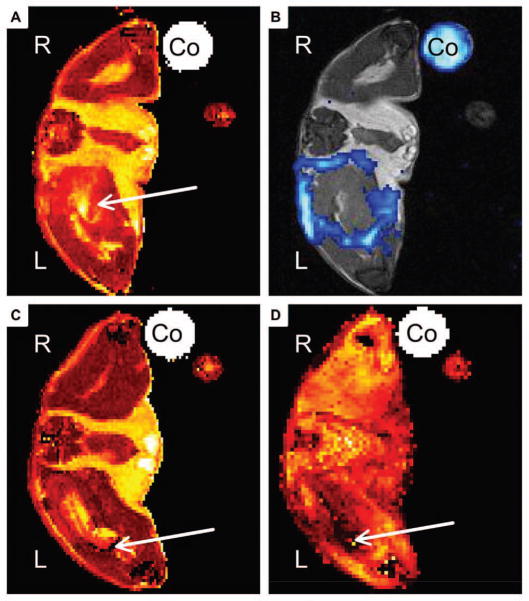
MRI of inflammation using in situ macrophage labeling in a mouse model of acute soft-tissue infection (55). Panels (A) and (B) shows images at day 2 post infection showing regions of macrophage burden in thigh. Images were acquired 24 hours after in situ PFC administration. (A) Displays 1H T2 map, where hyperintensity is clearly observed at site of muscle infection (arrow). (B) Shows 19F CSI overlay (blue) on anatomical 1H image (grayscale), where the 19F image shows pronounced accumulation of PFC at the rim of abscess area. Panels (C) and (D) show same mouse model infused with iron-oxide nanoparticles with same timing as above. (C) Displays 1H T2 map and shows diffuse hyperintense region at site of infection (arrow). Panel (D) is a T2*-weighted image that shows diffusely distributed susceptibility effects in the infected muscle (arrow). (“Co” is capillary tube filled with PFC dilution, “R” is right side, and “L” is left side of mouse).
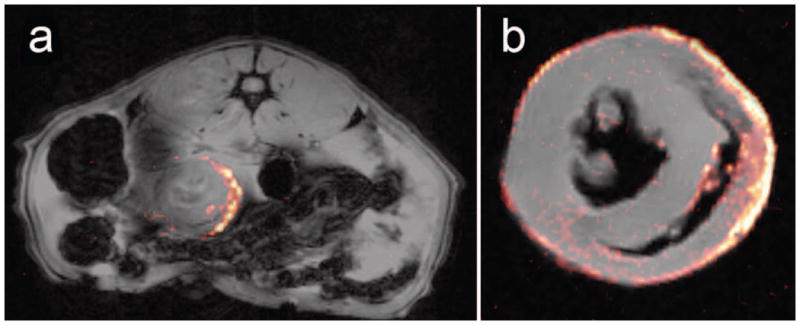
In situ PFC labeling detects macrophage infiltration in a heterotopic myocardium transplantation model (34). A working en bloc donor heart and lung from DA rat was transplanted to a recipient BN rat abdomen (day 0), leaving the native heart intact. At day 5 an intravenous injection of PFC was given, and 24 hours later a composite in vivo
19F/1H image (a) displays macrophage infiltration in the allograft myocardium (19F is hot-iron pseudo-color). The native heart shows no 19F signal (data not shown). Images were acquired in about 20 min at 7 T using a conventional gradient-echo sequence [data acquisition details given in Ref. (34)]. (b) 19F signal in the myocardium was confirmed using high resolution ex vivo MRI of the fixed heart.
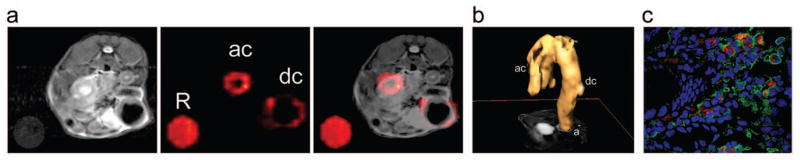
Inflammatory bowel disease (IBD) in an IL-10−/− mouse model visualized using in situ PFC labeling and 19F MRI (4). The 1H/19F MRI reveals PFC distribution in colon walls in a representative IBD mouse. (A) In vivo axial slices through the abdomen of a single mouse shows PFC accumulation in the ascending (ac) and descending colon (dc) in a mouse two days post-injection. The left panel shows 1H images (grayscale), the middle panel shows corresponding 19F images (pseudocolor ), and the right panel shows composite 1H/19F images. “R” represents a reference tube alongside the torso containing PFC emulsion. Panel (B) is a 3D rendering of the in vivo
19F MRI data from the abdomen in the IL-10−/− mice; substantial inflammation in the ascending and descending colon is apparent. Here, “ac” = ascending colon, “dc” = descending colon and “a” = anus. No manual image segmentation is used to make rendering, just noise thresholding of the 19F data. Panel (C) shows that macrophage burden forms the basis of 19F signal in the colon. Data is immunohistochemistry of the colon in IL-10−/− mice and shows that PFC labeled with DiI (red) (3) is localized within the macrophages (F4/80, green) at 2 days. Nuclei are stained with Hoechst 33342 (blue). The same study shows that PFC-DiI does not colocalize with ly6c positive cells or endothelial cells (data not shown).
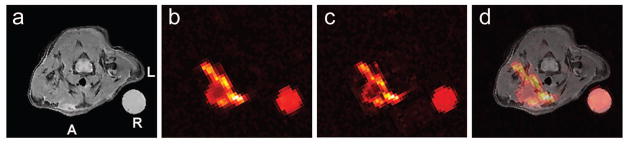
Compressed sensing 3D data acquisition schemes can accelerate 19F cell tracking studies. A pseudorandom CS undersampling schemes emphasizing the k-space center was used, with an acceleration factor (AF) of 8-fold (84). Undersampling occurs in the two phase encoding directions (matrix size 128 × 128), whereas in the readout direction the k-space remains fully sampled. Panels (a–d) show in vivo
19F 3D CS-RARE images in a localized inflammation mouse model (84). The pseudo-colored images show macrophage (PFC) accumulation in the region of wounding-induced inflammation. Panel (a) shows a T2-weighted anatomical 1H image. Panel (b) is a single slice from a 3D 19F CS-RARE image with AF=8 and 8 averages. Panel (c) is an AF=1 (fully-sampled k-space) RARE image with 8 averages. (d) Displays a 1H/19F fused image of (a+b). The PFC emulsion was injected 24 hours after injury and imaged at 72 hours. Here, A=anterior wall, L=left, and R= reference.
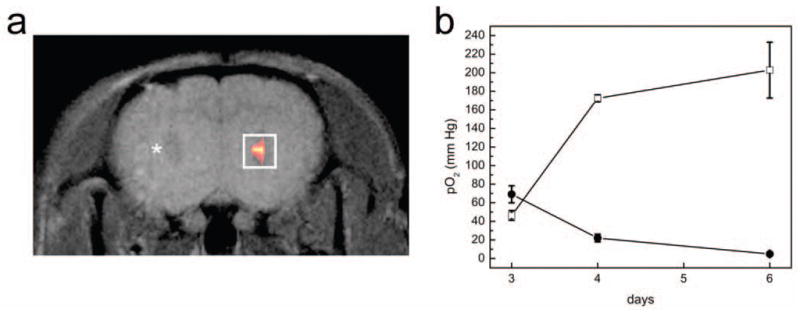
In vivo
19F MRI and pO2 sensing in rat brain glioma (43). (a) A composite 19F/1H image of the labeled 9L glioma cells stereotaxically injected into the right striatum three days prior. The 19F is rendered in a hot-iron intensity scale and the 1H is grayscale. The white rectangular box encompassing the 19F signal represents the approximate voxel placement for MRS. Panel (b) shows the longitudinal pO2 changes after BCNU treatment. Post-BCNU, the pO2 increase persists for at least 72 hours (day 6). In controls, pO2 gradually decreased from day 3 to day 6 (closed circles).
References
-
- Srinivas M, Morel PA, Ernst LA, Laidlaw DH, Ahrens ET. Fluorine-19 MRI for visualization and quantification of cell migration in a diabetes model. Magn Reson Med. 2007;58(4):725–734. - PubMed
-
- Riess JG. Oxygen carriers (“blood substitutes”) - Raison d’etre, chemistry, and some physiology. Chem Rev. 2001;101(9):2797–2919. - PubMed
Publication types
MeSH terms
Substances
Grants and funding
LinkOut - more resources
Full Text Sources
Other Literature Sources
Medical
Miscellaneous
