

Combined mutation of Vhl and Trp53 causes renal cysts and tumours in mice
- PMID: 23606570
- PMCID: PMC3779454
- DOI: 10.1002/emmm.201202231
Combined mutation of Vhl and Trp53 causes renal cysts and tumours in mice
Abstract
The combinations of genetic alterations that cooperate with von Hippel-Lindau (VHL) mutation to cause clear cell renal cell carcinoma (ccRCC) remain poorly understood. We show that the TP53 tumour suppressor gene is mutated in approximately 9% of human ccRCCs. Combined deletion of Vhl and Trp53 in primary mouse embryo fibroblasts causes proliferative dysregulation and high rates of aneuploidy. Deletion of these genes in the epithelium of the kidney induces the formation of simple cysts, atypical cysts and neoplasms, and deletion in the epithelia of the genital urinary tract leads to dysplasia and tumour formation. Kidney cysts display a reduced frequency of primary cilia and atypical cysts and neoplasms exhibit a pro-proliferative signature including activation of mTORC1 and high expression of Myc, mimicking several cellular and molecular alterations seen in human ccRCC and its precursor lesions. As the majority of ccRCC is associated with functional inactivation of VHL, our findings suggest that for a subset of ccRCC, loss of p53 function represents a critical event in tumour development.
Copyright © 2013 The Authors. Published by John Wiley and Sons, Ltd on behalf of EMBO.
Figures
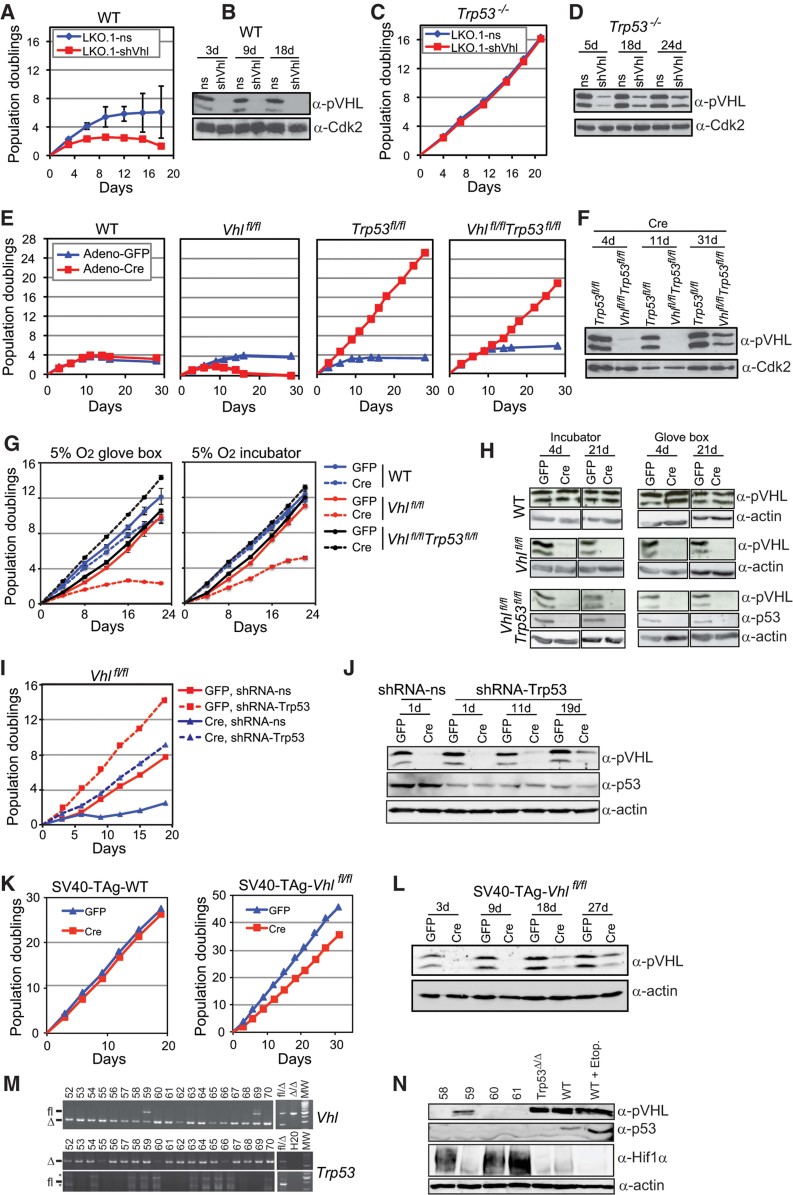
A,C. Proliferation assays of wild-type (A) and Trp53−/− (C) MEFs following infection with pLKO.1 lentiviruses expressing a non-silencing sequence (ns) or shRNA directed against Vhl (shVhl).
B,D. Western blotting analysis for pVHL in cells from A and C at the time points (number of days after infection) indicated. Immunoblotting using an antibody against Cdk2 served as a loading and transfer control.
E. Proliferation assays of wild-type, Vhlfl/fl, Trp53fl/fl or Vhlfl/flTrp53fl/fl MEFs following infection with adenoviruses expressing GFP (GFP) or Cre-GFP (Cre).
F. Western blotting analysis of Trp53fl/fl and Vhlfl/flTrp53fl/fl MEFs in E at the indicated time points. Immunoblotting using an antibody against actin served as a loading and transfer control.
G. Proliferation assays of wild-type, Vhlfl/fl and Vhlfl/flTrp53fl/fl MEFs in 5% oxygen.
H. Western blotting analysis of cells from G at the indicated timepoints.
I. Proliferation assays of Vhlfl/fl MEFs infected with GFP or Cre and lentiviruses expressing an empty miR30 shRNA (shRNA-ns) or miR30-format shRNA directed against Trp53 (shRNA-Trp53).
J. Western blotting analysis of cells from I at the indicated time points.
K. Proliferation assays of SV40 T-antigen transformed WT and Vhlfl/fl MEFs following GFP or Cre infection.
L. Western blotting analysis of SV40-TAg-Vhlfl/fl from K at the indicated timepoints.
M. Cell lines (52–70) derived from Cre-infected Vhlfl/flTrp53fl/fl MEFs genotyped for floxed (fl) and deleted (Δ) Vhl and Trp53 alleles. Samples with known Vhl and Trp53 genotypes served as controls, MW: molecular weight markers, * non-specific bands.
N. Western blotting analysis of clones 58–61 for pVHL, p53 and Hif1α, confirming the loss of p53 expression and presence and functionality of pVHL expression in clone 59. Lysates from Trp53 null MEFs, wild-type MEFs or wild-type MEFs treated with etoposide (10 µM, 6 h) served as controls for the p53 protein.
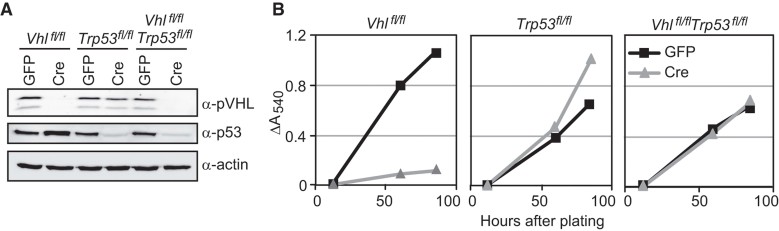
Western blotting analysis of primary kidney epithelial cell cultures derived from Vhlfl/fl, Trp53fl/fl or Vhlfl/flTrp53fl/fl mice 3 days after infection with adenoviruses expressing GFP or Cre.
Proliferation of cells from A assessed using an SRB assay to detect increase in total protein content of the culture over time.
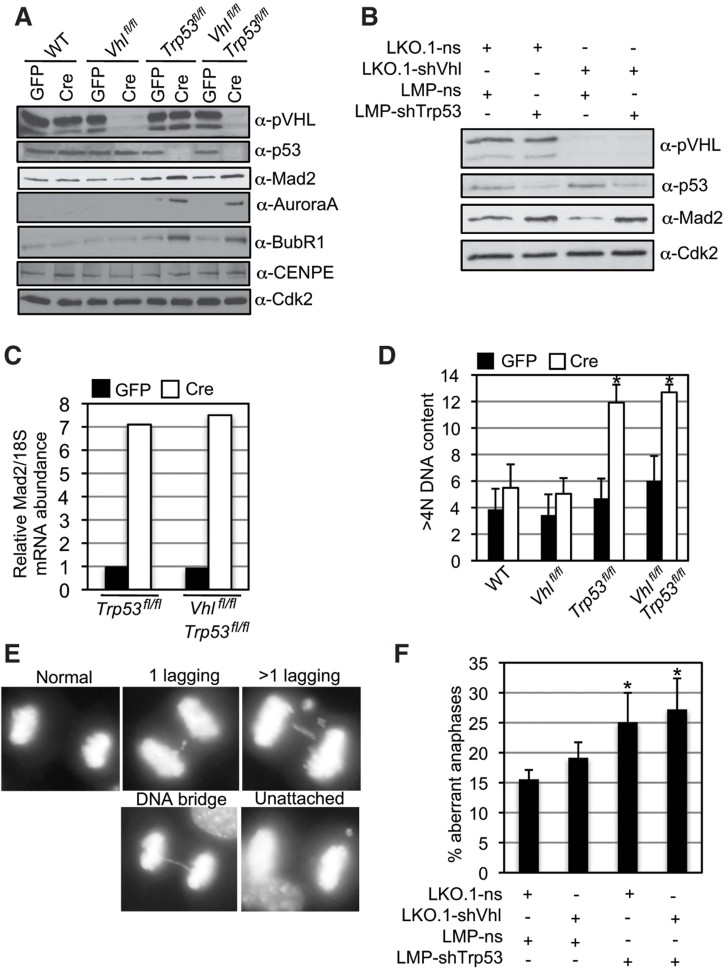
Western blotting analysis of wild-type, Vhlfl/fl, Trp53fl/fl or Vhlfl/flTrp53fl/fl MEFs infected with adenoviruses expressing GFP (GFP) or Cre-GFP (Cre).
Western blotting analysis of wild-type MEFs infected with combinations of pLKO.1 lentiviruses expressing a non-silencing sequence (ns) or shRNA directed against Vhl (shVhl) and LMP retroviruses expressing a non-silencing sequence (ns) or shRNA directed against Trp53 (shTrp53).
Real-time quantitative PCR analysis of Mad2 mRNA abundance normalized to 18S mRNA abundance in GFP and Cre infected Trp53fl/fl and Vhlfl/flTrp53fl/fl MEFs.
Frequency of cells with greater than 4N DNA content as assessed by flow cytometric analysis. Results represent mean ± SD of triplicate samples and * represents statistically significant differences between GFP and Cre treated cells of the same genotype (Student's t-test, p < 0.01).
Depiction of a normal anaphase and examples of anaphases showing a range of chromosome segregation defects.
Anaphases of cells from B were scored five days after infection according to the scheme shown in E and the percentage of aberrant anaphases calculated. Data represent mean ± SD of triplicate samples (in each n > 120 anaphases were counted) and * represents statistically significant differences to cells infected with both ns vectors (Student's t-test, p < 0.01).

A,B. Normal external appearance of kidneys from 6 month-old VhlΔ/ΔTrp53Δ/Δ mice.
C–F. Histological appearance of cortex of kidneys from 6 month-old wild-type (C), VhlΔ/Δ (D), Trp53Δ/Δ (E) and VhlΔ/ΔTrp53Δ/Δ (F) mice. The dotted region outlined in F is an example of an abnormal cluster of cells.
G. Example of lesions arising in the cortex of a kidney from a 1-year-old VhlΔ/ΔTrp53Δ/Δ mouse. AC: atypical cyst, SC: simple cyst, NEO: neoplasm.
H–K. Examples of lesions found in kidneys of one year-old VhlΔ/ΔTrp53Δ/Δ mice; simple tubular cyst (H), atypical cyst (I), neoplasm with cystic precursor (J) and solid neoplasm (K). Insets in H and I show high magnification of the cystic epithelium.
L. High magnification of a solid neoplasm showing clear cell morphology and low nuclear grade.
M–P. Representative Ki67 stainings of histologically normal epithelium (M), a simple cyst (N), an atypical cyst (O) and a neoplasm (P) in VhlΔ/ΔTrp53Δ/Δ mouse kidneys.
Q,R. Anti-HIF1α and anti-HIF2α immunohistochemistry of serial sections of a simple cyst.
S,T. Anti-HIF1α and anti-HIF2α immunohistochemistry of serial sections of a neoplastic lesion.
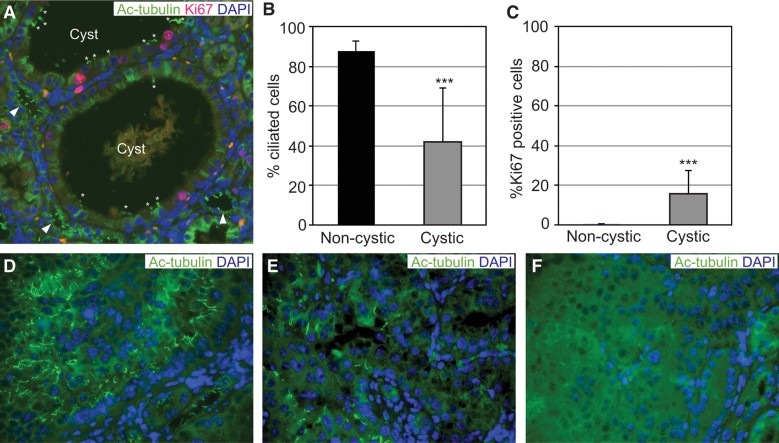
A. Immunofluorescence staining of formalin-fixed paraffin embedded tissue for acetylated tubulin (green) to mark primary cilia, Ki67 (red) to mark proliferating cells and DAPI (blue) to mark nuclei in a cortical section of kidney from a VhlΔ/ΔTrp53Δ/Δ mouse. Arrowheads point to adjacent normal tubules showing a normal frequency of ciliated cells and * highlight primary cilia in cysts. Note the high frequency of Ki67 negative cells that lack a primary cilium.
B,C. Quantification of percentage of epithelial cells displaying a primary cilium (B) or staining for Ki67 (C) in non-cystic tubules (n = 18) or simple cysts (n = 39) in VhlΔ/ΔTrp53Δ/Δ mice. Mean and SD is shown, ***p < 0.001 Student's t-test.
D–F. Examples of neoplasms displaying varying frequencies of primary cilia.
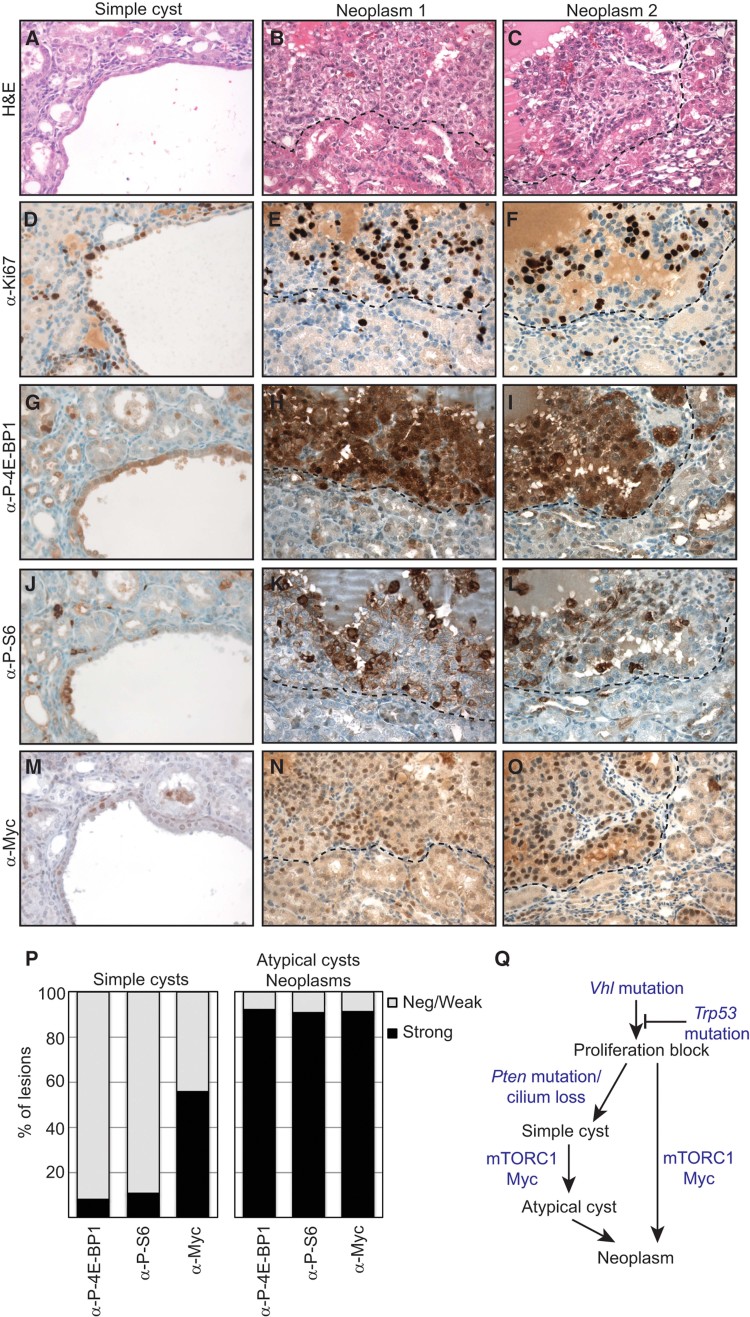
A–O. Serial sections of a simple cyst (A,D,G,J,M) and two neoplasms (B,E,H,K,N and C,F,I,L,O) stained with H&E (A–C) or stained immunohistochemically for Ki67 (D–F), phospho-Thr37/46-4E-BP1 (G–I), phospho-Ser240/244-ribosomal S6 protein (J–L) or Myc (M–O). Dotted lines indicate the boundary of normal tissue and neoplasms.
P. Quantification of the percentage of simple cysts (n = 68–185) or atypical cysts and neoplasms (n = 34–51) that display higher levels (strong) of staining than adjacent normal tissue in the same section (negative/weak).
Q. Model summarising the proposed sequence of morphological and molecular alterations involved in formation of ccRCC. For details see the Discussion Section.
References
-
- Custer M, Lotscher M, Biber J, Murer H, Kaissling B. Expression of Na-P(i) cotransport in rat kidney: localization by RT-PCR and immunohistochemistry. Am J Physiol. 1994;266:F767–F774. - PubMed
Publication types
MeSH terms
Substances
LinkOut - more resources
Full Text Sources
Other Literature Sources
Molecular Biology Databases
Research Materials
Miscellaneous
