. 2013 Jul;54(7):1949-63.
doi: 10.1194/jlr.M038992. Epub 2013 Apr 20.

Fatty acids regulate perilipin5 in muscle by activating PPARδ

Affiliations

Fatty acids regulate perilipin5 in muscle by activating PPARδ

Christian Bindesbøll et al. J Lipid Res. 2013 Jul.

Abstract

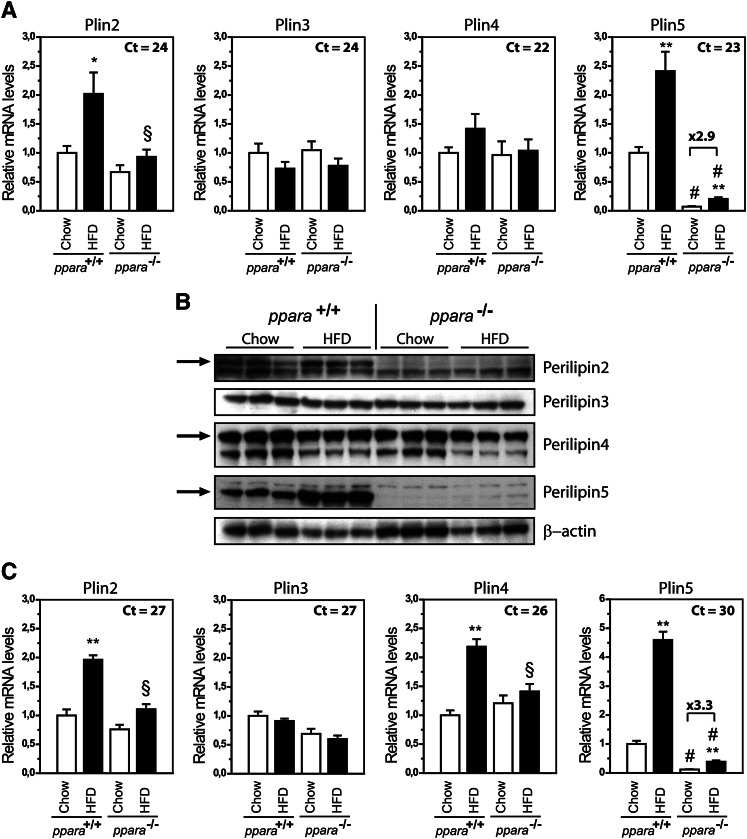
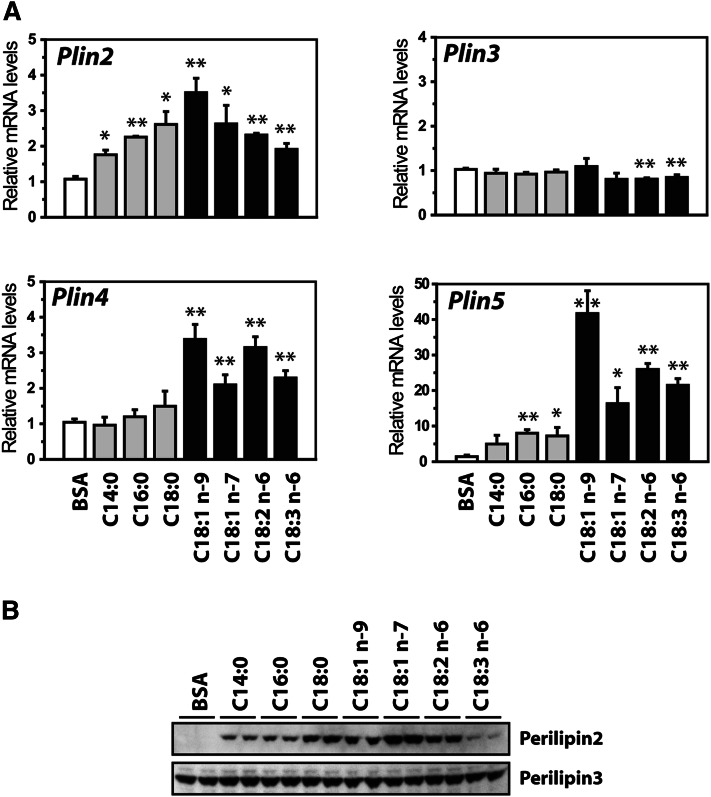
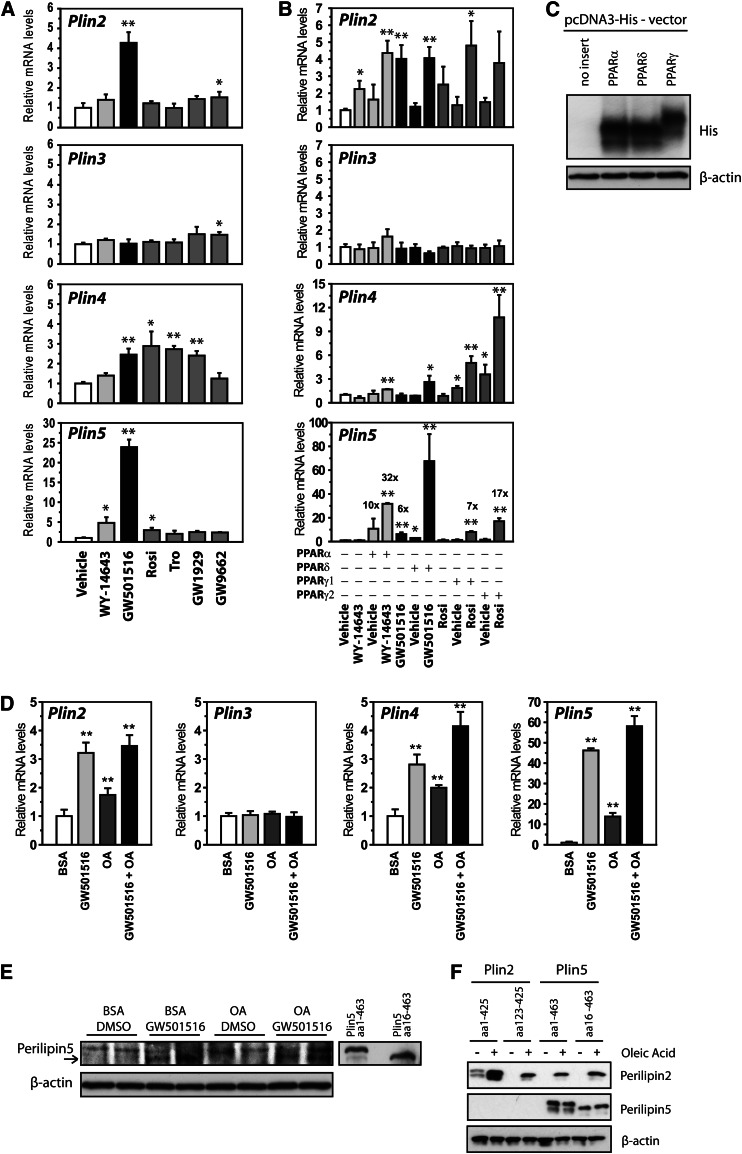
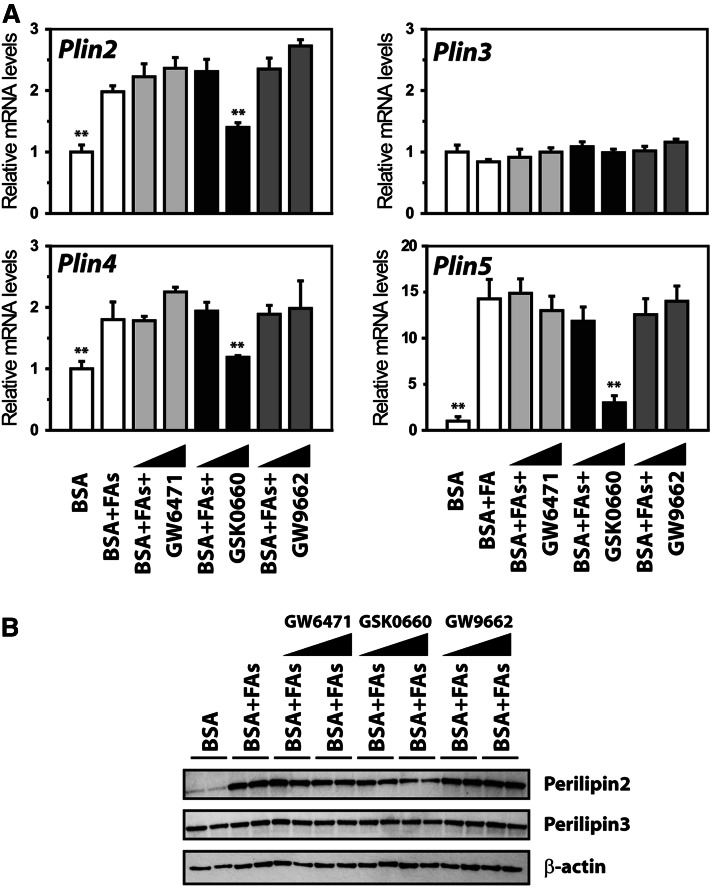
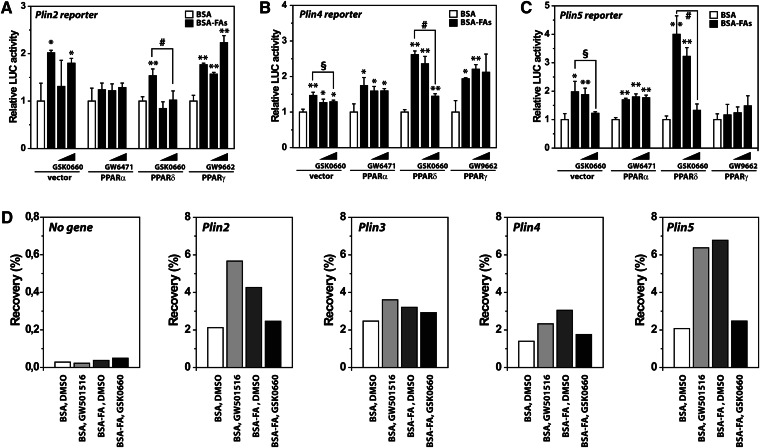
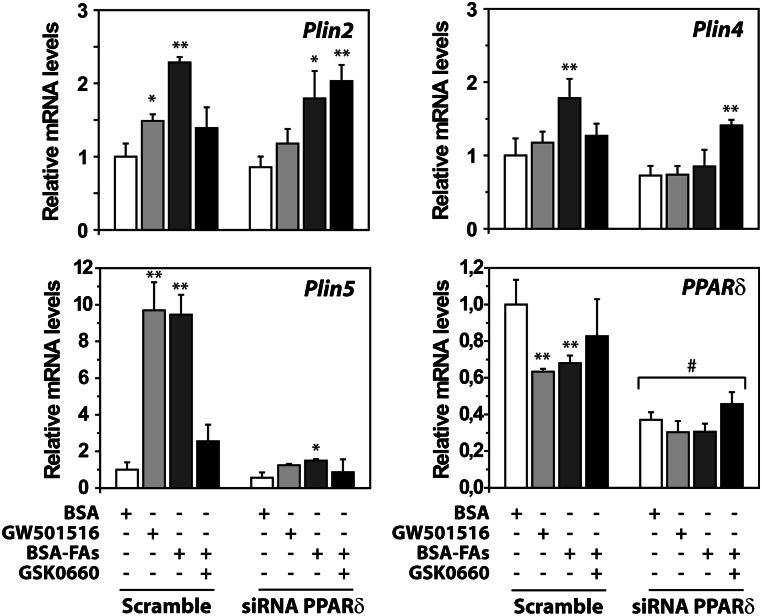
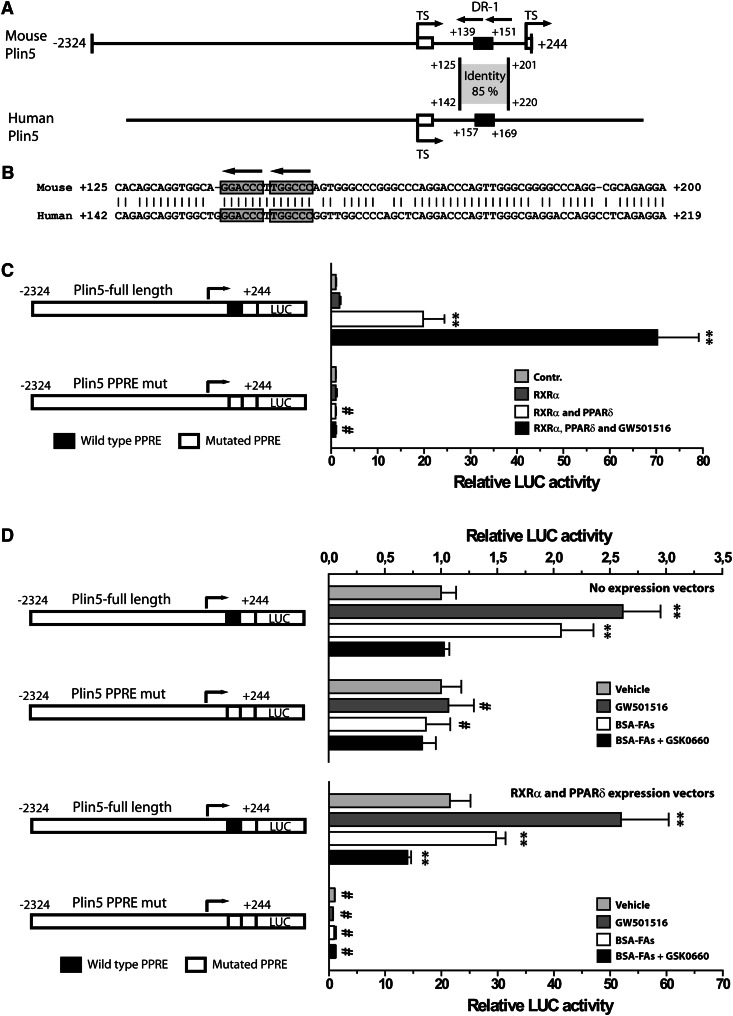
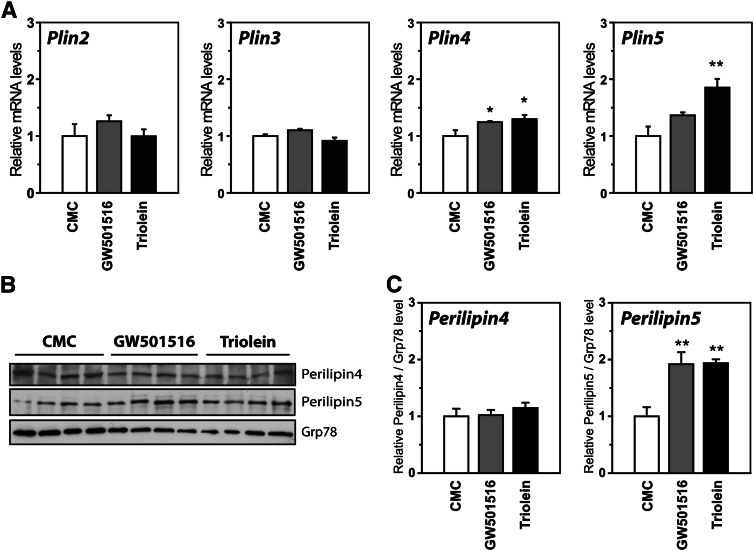
The surface of lipid droplets (LDs) in various cell types is coated with perilipin proteins encoded by the Plin genes. Perilipins regulate LD metabolism by selectively recruiting lipases and other proteins to LDs. We have studied the expression of perilipins in mouse muscle. The glycolytic fiber-enriched gastrocnemius muscle expresses predominantly Plin2-4. The oxidative fiber-enriched soleus muscle expresses Plin2-5. Expression of Plin2 and Plin4-5 is elevated in gastrocnemius and soleus muscles from mice fed a high-fat diet. This effect is preserved in peroxisome proliferator-activated receptor (PPAR)α-deficient mice. Mouse muscle derived C2C12 cells differentiated into glycolytic fibers increase transcription of these Plins when exposed to various long chain fatty acids (FAs). To understand how FAs regulate Plin genes, we used specific activators and antagonists against PPARs, Plin promoter reporter assays, chromatin immunoprecipitation, siRNA, and animal models. Our analyses demonstrate that FAs require PPARδ to induce transcription of Plin4 and Plin5. We further identify a functional PPAR binding site in the Plin5 gene and establish Plin5 as a novel direct PPARδ target in muscle. Our study reveals that muscle cells respond to elevated FAs by increasing transcription of several perilipin LD-coating proteins. This induction renders the muscle better equipped to sequester incoming FAs into cytosolic LDs.

Keywords: Lsdp5; Plin; Plin2; Plin3; Plin4; Plin5; S3-12; TIP47; oleic acid; perilipin; peroxisome proliferator-activated receptor response element; peroxisome proliferator-activated receptor δ; promoter.


Figures

Fig. 1.
Fig. 1.
Plin2 and Plin5 are increased in muscle of HFD-fed mice. Wild-type and PPARα−/− mice were fed chow or HFD for 13 weeks. A: Relative gene expression of Plin2-5 in soleus muscle normalized to 36B4. Results are presented as mean ± SEM (n = 6 for each group). Statistical differences between groups: chow versus HFD (*P < 0.05, **P < 0.01) and between genotypes with same feeding (§P < 0.05, #P < 0.01). B: Perilipin protein levels in soleus muscle. Each lane contains proteins pooled from six mice. The arrows indicate protein signals migrating at the same size as ectopically expressed perilipin2, perilipin4, and perilipin5. The identity of the smaller protein band observed for perilipin4 is unknown. C: Gene expression of Plin2-5 in gastrocnemius muscle. The results are presented as described for soleus muscle.
Fig. 2.
Fig. 2.
FAs regulate expression of Plin genes in C2C12 cells. C2C12 cells were differentiated until day 6 and stimulated with BSA alone (40 μM) or various FAs complexed to BSA (100 μM FA:40 μM BSA) for 24 h. FAs used: myristic acid (C14:0), palmitic acid (C16:0), stearic acid (C18:0), oleic acid (cis-C18:1 n-9), vaccenic acid (cis-C18:1 n-7), linoleic acid (C18:2 n-6), and γ-linolenic acid (C18:3n-6). All wells received equal amounts of BSA. A: Relative gene expression of Plin2-5 in C2C12 cells normalized to 36B4. Results are presented as mean ± SD (n = 3, *P > 0.05, **P > 0.01). B: C2C12 cells were stimulated with FA as described above. Western blots of perilipin2 and perilipin3 indicate that LDs were formed. Data are from a representative Western blot from two independent experiments.
Fig. 3.
Fig. 3.
PPARδ activates protein and gene expression of perilipin5 in C2C12 cells. A: C2C12 cells were differentiated until day 6 and stimulated 24 h with vehicle (0.1% DMSO) or agonists for PPARα (WY-14643; 10 μM), PPARδ (GW501516; 0.1 μM), or PPARγ (Rosi/BRL-49653, 1 μM; Tro, 1 μM; and GW1929, 1 μM), or an antagonist for PPARγ (GW9662; 1 μM). All wells received equal amounts of vehicle (0.1% DMSO). Relative gene expression of Plin2-Plin5 normalized to 36B4. B: C2C12 cells were transfected with pcDNA3 vector (control) or various pcDNA3-PPAR expression vectors at day 0, differentiated for 3 days and stimulated with selective PPAR activators for 24 h. Activators of PPARα (WY-14643; 10 μM), PPARδ (GW501516; 0.1 μM), or PPARγ (Rosi/BRL-49653; 1 μM). Relative gene expression of Plin2-5 normalized to 36B4. Results are presented as mean ± SD (n = 3, *P > 0.05, **P > 0.01). C: C2C12 cells were transfected with pcDNA3-6xHis-V5-PPARα, -PPARδ, or -PPARγ expression vectors and the relative expression level of each PPAR isoform was determined by Western blot using a His antibody. D, E: C2C12 cells were differentiated in the presence of a PPARδ activator (GW501516; 0.1 μM) and/or BSA-OA (100 μM) from day 0 until day 7. D: Relative gene expression of Plin2-5 normalized to 36B4. Results are presented as mean ± SD (n = 3). Statistical differences refer to BSA (**P < 0.01). E: The short perilipin5 (perilipin5 aa16-463) protein was increased following PPARδ agonist (GW501516) treatment. The Western blot shows two independent samples per treatment. F: C2C12 cells were transfected with pcDNA3-Plin2, -Plin2 aa125-425, -Plin5, or -Plin5 aa16-463 at day 0, differentiated for 3 days, and stimulated with BSA-OA (100 μM) for an additional 24 h. Perilipin2 and perilipin5 protein amounts were analyzed using specific perilipin antibodies. Each lane contains proteins pooled from three independent wells.
Fig. 4.
Fig. 4.
Long chain FAs fail to induce Plin5 expression in the presence of a PPARδ antagonist. C2C12 cells were differentiated until day 6 and treated for 24 h with BSA or BSA-FA (50 μM BSA-OA and 50 μM BSA-LA) in combination with antagonists for PPARα (GW6471; 0.1 or 1 μM), PPARδ (GSK0660; 0.1 or 1 μM), or PPARγ (GW9662; 0.1 or 1 μM). All wells received equal amounts of vehicle (0.1% DMSO) and BSA (40 μM). A: Relative gene expression of Plin2-5 normalized to 36B4. Results are presented as mean ± SD (n = 3). Statistical differences were evaluated against cells receiving BSA-FAs (**P > 0.01). B: C2C12 cells were stimulated as above and perilipin2 and perilipin3 proteins were detected. One representative Western blot from two independent experiments is shown.
Fig. 5.
Fig. 5.
PPARδ transactivates Plin genes. C2C12 cells were transfected at day 0 with Plin reporters and cotransfected with pcDNA3 vector (control) or various pcDNA3-PPAR expression vectors as illustrated. After differentiation for 72 h, cells were treated for 24 h with BSA-FA (50 μM OA and 50 μM LA) in combination with increasing concentrations of antagonists for PPARα (GW6471; 0.1 or 1 μM), PPARδ (GSK0660; 0.1 or 1 μM), or PPARγ (GW9662; 0.1 or 1 μM). A: Luciferase values for the mouse Plin2 reporter. B: Luciferase values for the mouse Plin4 reporter. C: Luciferase values for the mouse Plin5 reporter. One representative of three experiments is shown. Results are presented as mean ± SD (n = 3). Statistical differences from BSA (*P > 0.05, **P > 0.01) or between treatments as indicated in the figure (§P > 0.05, #P > 0.01). D: C2C12 cells were differentiated until day 6 and treated for 24 h with BSA, a PPARδ agonist (GW501516; 0.1 μM), or BSA-FA (50 μM OA and 50 μM LA) with or without an antagonist to PPARδ (GSK0660; 1 μM). Cells were processed for ChIP using RNA Pol II antibody. Relative recovery at the no gene loci (control, a chromosomal nontranscribed loci), and the Plin2-5 locus were determined by ChIP-qPCR.
Fig. 6.
Fig. 6.
Silencing of PPARδ attenuates the stimulating effect of FAs on Plin gene transcription. C2C12 cells were transfected at day 0 with scramble or siRNA against PPARδ and differentiated for 2 days prior to stimulation for 24 h with BSA, GW501516 (0.1 μM), BSA-FAs (50 μM OA and 50 μM LA), or BSA-FAs in combination with antagonist to PPARδ (GSK0660; 1 μM). All wells received equal amounts of vehicle (0.1% DMSO) and BSA (40 μM). Relative expression of various RNAs against 36B4 was evaluated using quantitative real-time PCR analysis. Relative expression of Plin2, Plin4, Plin5, and PPARδ. Results are shown as mean ± SD (n = 3). Difference from control (BSA; *P > 0.05, **P > 0.01). Difference among scramble or PPARδ siRNA-treated cells receiving similar treatment (#P > 0.01).
Fig. 7.
Fig. 7.
PPARδ regulates Plin5 through a conserved PPRE in intron 1. A: A schematic presentation of the cloned mouse Plin5 reporter (nucleotides −2,324 to +244), and the corresponding human Plin5 promoter. The two alternative transcriptional start sites (TS) are indicated by arrows. The localization of the conserved intron region and percentage identity to the human intronic segment is shown. The nucleotide position of the black boxes points out the localization of the PPREs. B: Sequence alignment and homology between nucleotides in the mouse and the human Plin5 intron 1 regions. The two half sites in the conserved PPRE are enclosed by boxes, and conserved nucleotides are indicated by vertical lines. C: Transient transfection of Plin5 full-length or mutated reporters into C2C12 cells. Cells were transfected, differentiated for 3 days, and stimulated with the indicated ligands for 24 h. Cells were cotransfected with pcDNA3 (control), pcDNA3-RXRα, or pcDNA3-PPARδ expression plasmids and stimulated with vehicle (DMSO) or GW501516 (0.1 μM). Results are presented as mean ± SD (n = 3). D: Transient transfection of Plin5 WT or mutated reporters in combination with no expression plasmid or RXRα and PPARδ expression plasmids. Cells were stimulated with BSA (light gray), GW501516 (0.1 μM; dark gray), BSA-FAs (50 μM OA and 50 μM LA; white), or BSA-FAs in combination with GSK0660 (1 μM; black). For (C) and (D), statistical differences from control treatment (**P < 0.01) or between Plin5 reporter constructs with same treatment (#P < 0.01).
Fig. 8.
Fig. 8.
Oleic acid or PPARδ agonist treatment of mice elevates Plin5 in soleus muscle. Mice were gavaged twice (36 and 12 h before being euthanized) with vehicle (0.5% CMC), GW501516 (5 mg/kg), or 400 μl glyceryl trioleate/triolein. Mice were euthanized at the onset of the light cycle. A: Relative gene expression of Plin2-5 in soleus muscle relative to TBP. Results are presented as mean ± SEM (n = 4–6 per group). Statistical differences from CMC treatment (*P < 0.05, **P < 0.01). B: Western blot of perilipin4, perilipin5, and grp78 (control) proteins in soleus muscle. Each treatment is represented by four independent mice. C: Relative levels of perilipins/grp78 (n = 4, difference from CMC treatment, **P < 0.01).

References

    1. Eckardt K., Taube A., Eckel J. 2011. Obesity-associated insulin resistance in skeletal muscle: role of lipid accumulation and physical inactivity. Rev. Endocr. Metab. Disord. 12: 163–172 - PubMed
    1. Samuel V. T., Shulman G. I. 2012. Mechanisms for insulin resistance: common threads and missing links. Cell. 148: 852–871 - PMC - PubMed
    1. Amati F., Dube J. J., Alvarez-Carnero E., Edreira M. M., Chomentowski P., Coen P. M., Switzer G. E., Bickel P. E., Stefanovic-Racic M., Toledo F. G., et al. 2011. Skeletal muscle triglycerides, diacylglycerols, and ceramides in insulin resistance: another paradox in endurance-trained athletes? Diabetes. 60: 2588–2597 - PMC - PubMed
    1. Brasaemle D. L. 2007. The perilipin family of structural lipid droplet proteins: stabilization of lipid droplets and control of lipolysis. J. Lipid Res. 48: 2547–2559 - PubMed
    1. Bickel P. E., Tansey J. T., Welte M. A. 2009. PAT proteins, an ancient family of lipid droplet proteins that regulate cellular lipid stores. Biochim. Biophys. Acta. 1791: 419–440 - PMC - PubMed

Publication types

MeSH terms