

Improving spatial adaptivity of nonlocal means in low-dosed CT imaging using pointwise fractal dimension
- PMID: 23606907
- PMCID: PMC3626180
- DOI: 10.1155/2013/902143
Improving spatial adaptivity of nonlocal means in low-dosed CT imaging using pointwise fractal dimension
Abstract
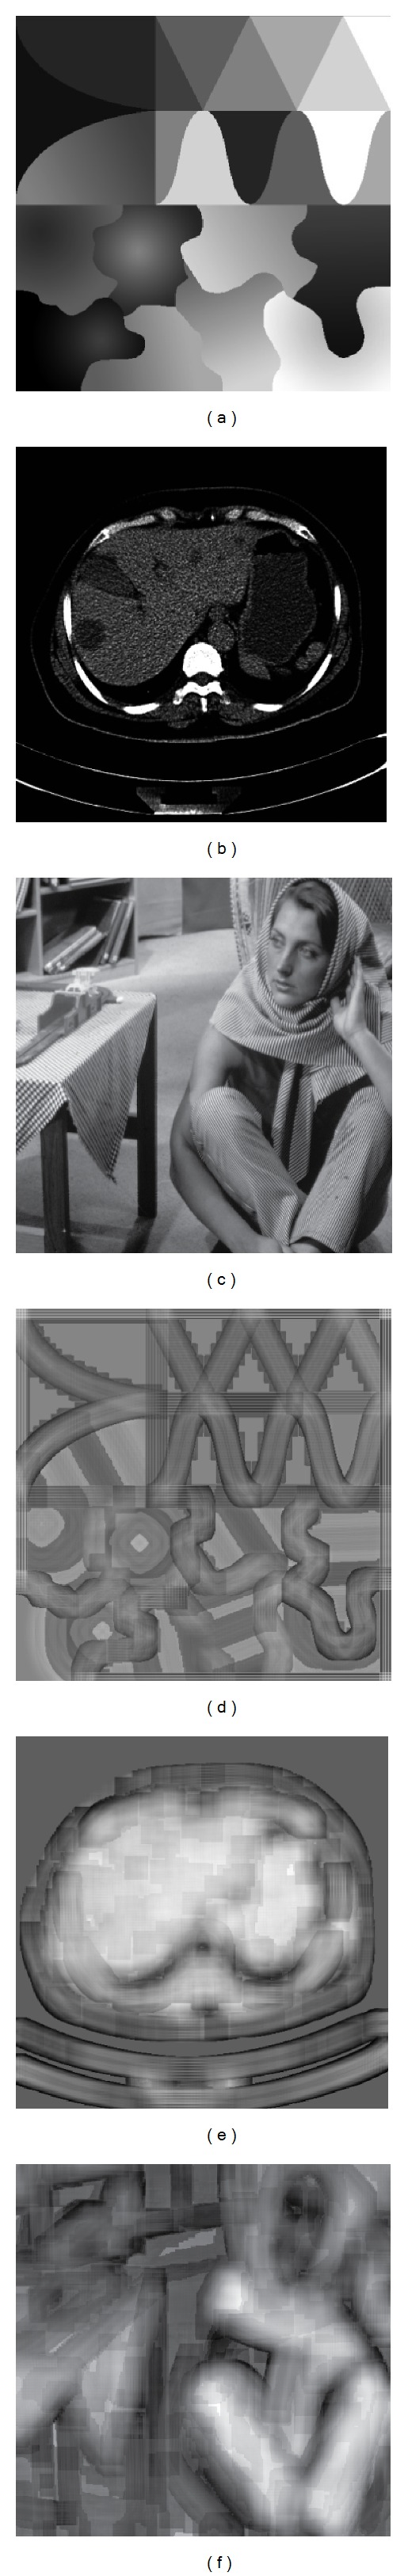
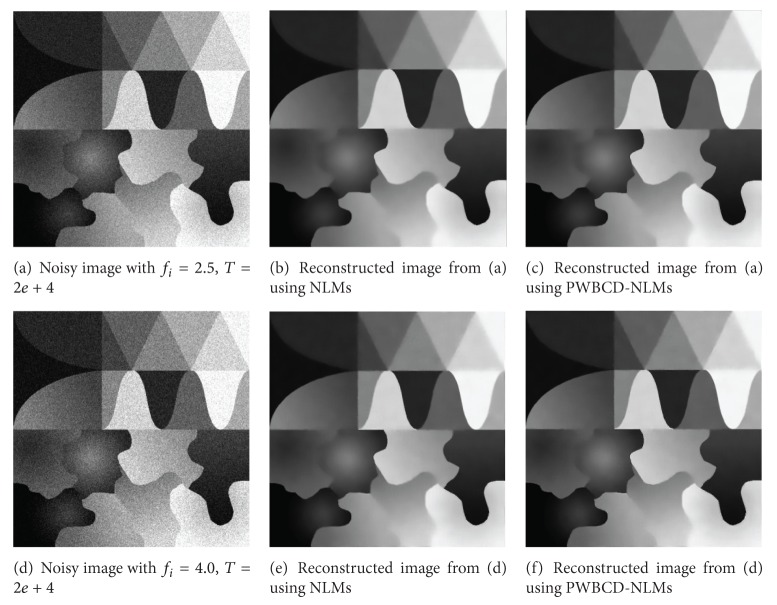
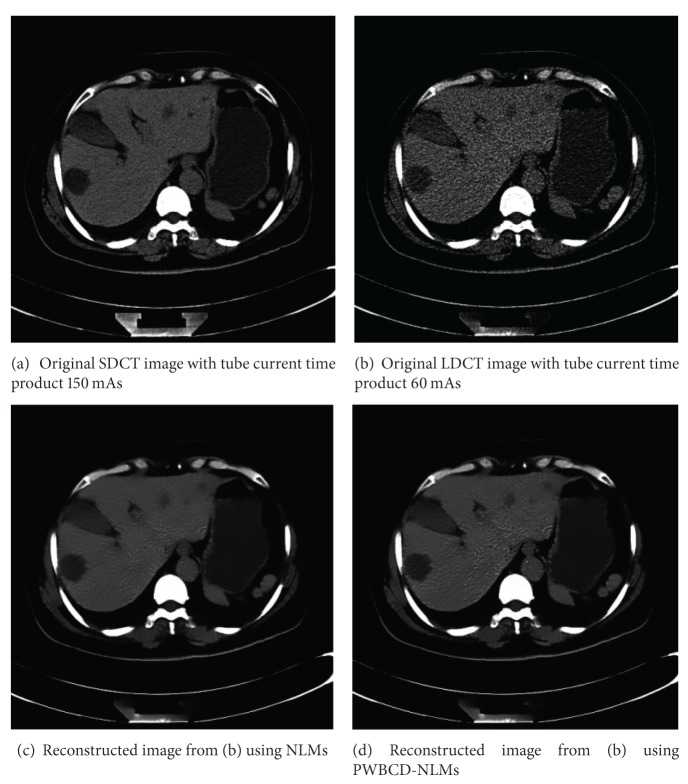
NLMs is a state-of-art image denoising method; however, it sometimes oversmoothes anatomical features in low-dose CT (LDCT) imaging. In this paper, we propose a simple way to improve the spatial adaptivity (SA) of NLMs using pointwise fractal dimension (PWFD). Unlike existing fractal image dimensions that are computed on the whole images or blocks of images, the new PWFD, named pointwise box-counting dimension (PWBCD), is computed for each image pixel. PWBCD uses a fixed size local window centered at the considered image pixel to fit the different local structures of images. Then based on PWBCD, a new method that uses PWBCD to improve SA of NLMs directly is proposed. That is, PWBCD is combined with the weight of the difference between local comparison windows for NLMs. Smoothing results for test images and real sinograms show that PWBCD-NLMs with well-chosen parameters can preserve anatomical features better while suppressing the noises efficiently. In addition, PWBCD-NLMs also has better performance both in visual quality and peak signal to noise ratio (PSNR) than NLMs in LDCT imaging.
Figures
References
-
- Brenner DJ, Hall EJ. Computed tomography-an increasing source of radiation exposure. New England Journal of Medicine. 2007;357(22):2277–2284. - PubMed
-
- Hansen J, Jurik AG. Survival and radiation risk in patients obtaining more than six CT examinations during one year. Acta Oncologica. 2009;48(2):302–307. - PubMed
-
- Brisse HJ, Brenot J, Pierrat N, et al. The relevance of image quality indices for dose optimization in abdominal multi-detector row CT in children: experimental assessment with pediatric phantoms. Physics in Medicine and Biology. 2009;54(7):1871–1892. - PubMed
-
- Weidemann J, Stamm G, Galanski M, Keberle M. Comparison of the image quality of various fixed and dose modulated protocols for soft tissue neck CT on a GE Lightspeed scanner. European Journal of Radiology. 2009;69(3):473–477. - PubMed
Publication types
MeSH terms
LinkOut - more resources
Full Text Sources
Other Literature Sources
Medical
