. 2013 Apr 16:2:e00288.
doi: 10.7554/eLife.00288.

Rapid localized spread and immunologic containment define Herpes simplex virus-2 reactivation in the human genital tract

Affiliations

Rapid localized spread and immunologic containment define Herpes simplex virus-2 reactivation in the human genital tract

Joshua T Schiffer et al. Elife. .

Abstract

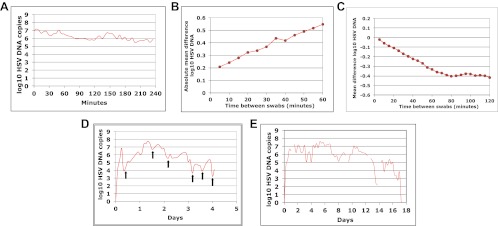
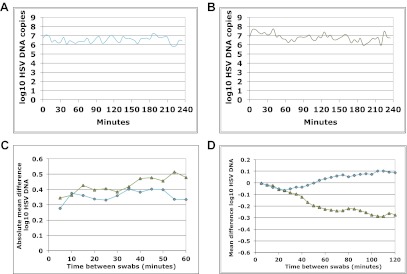
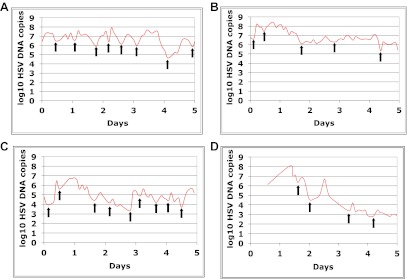
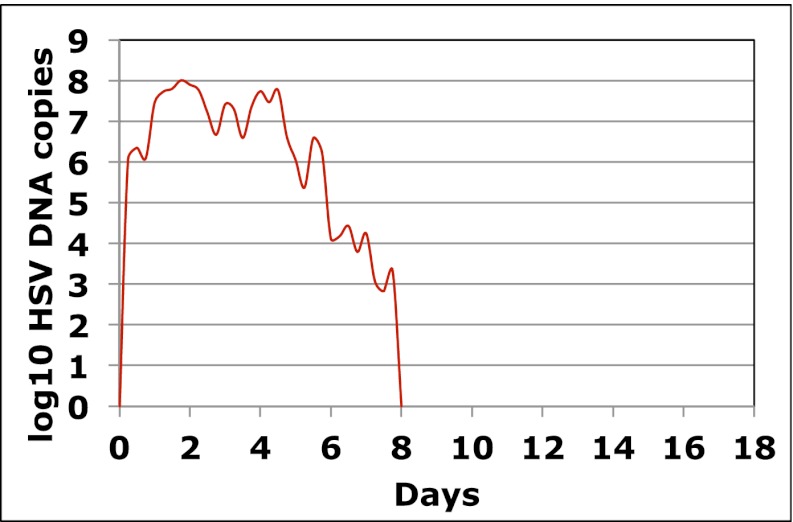
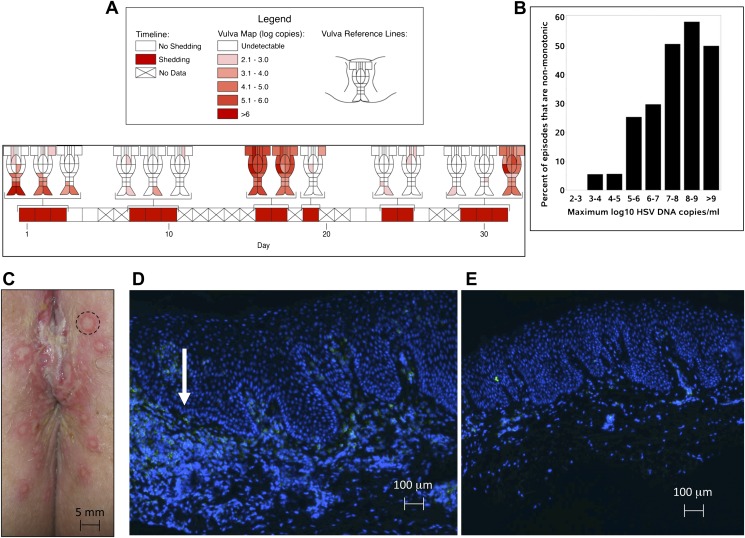
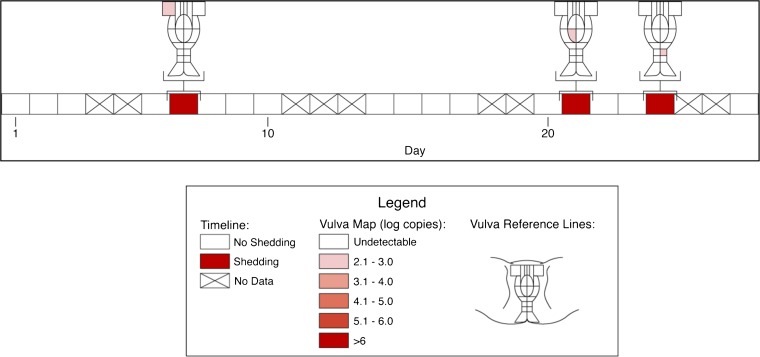
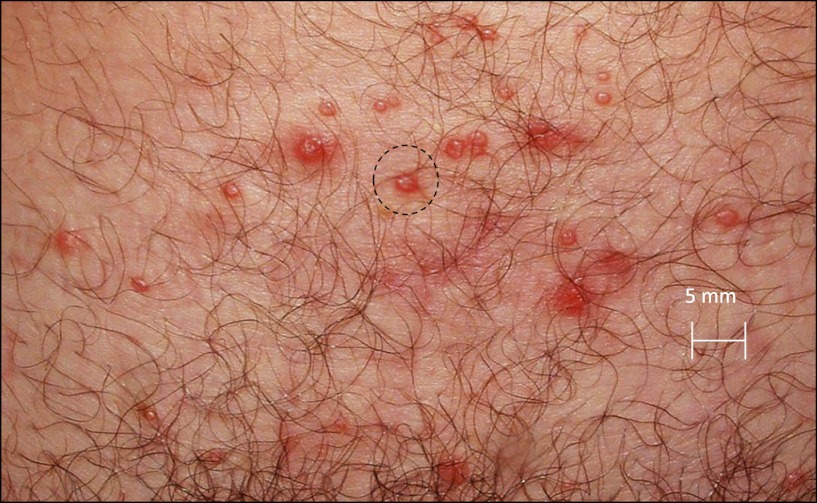
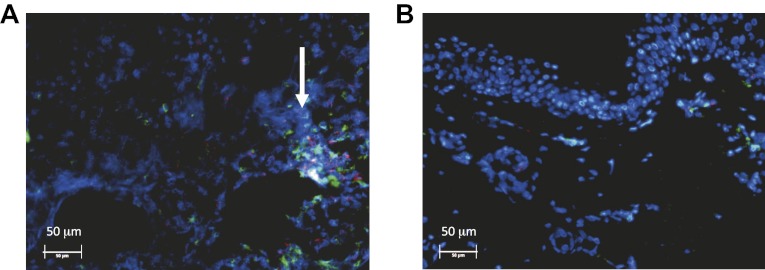
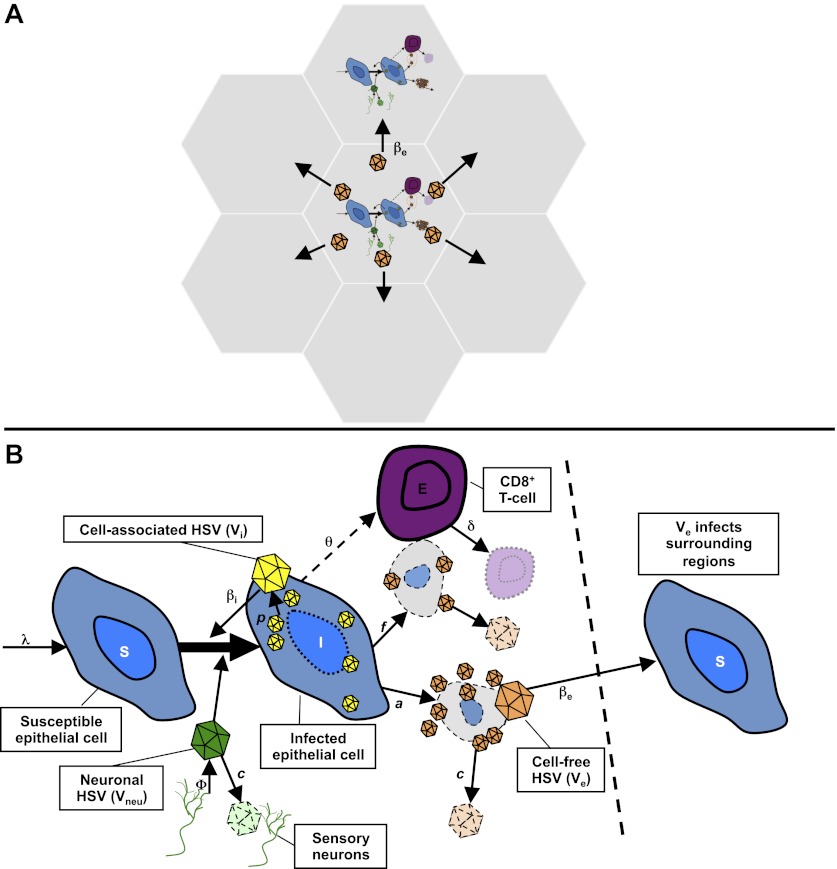
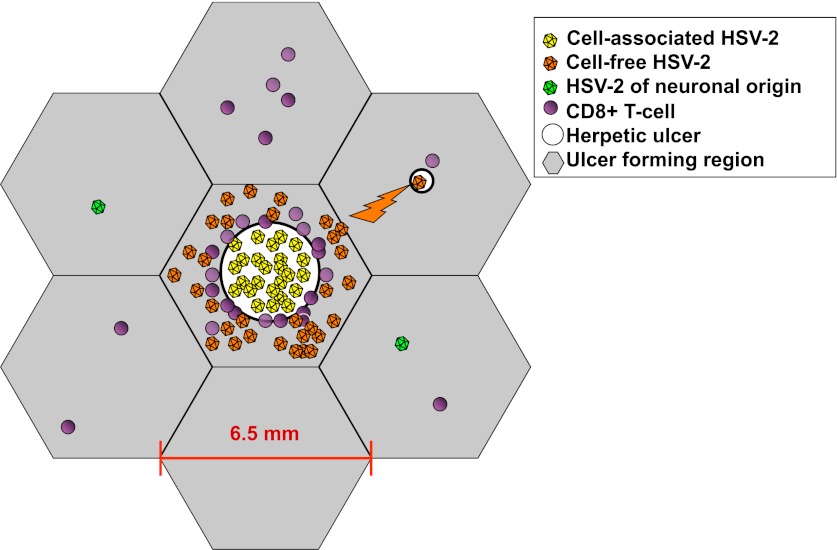
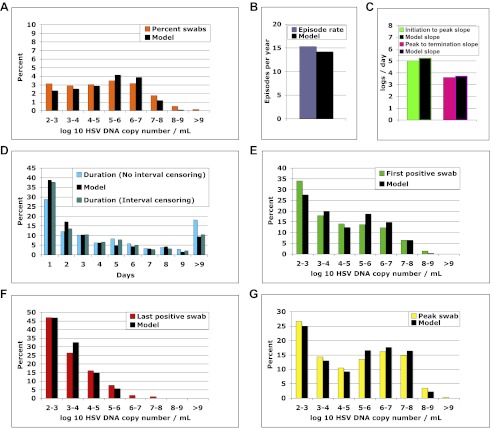
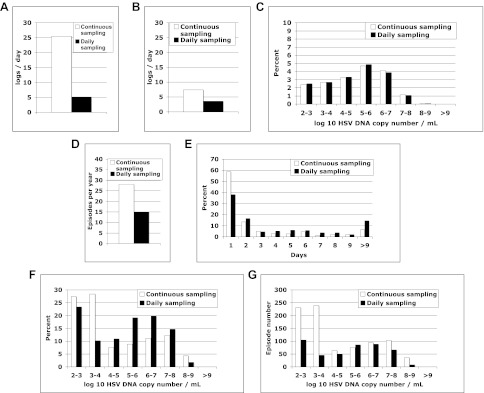
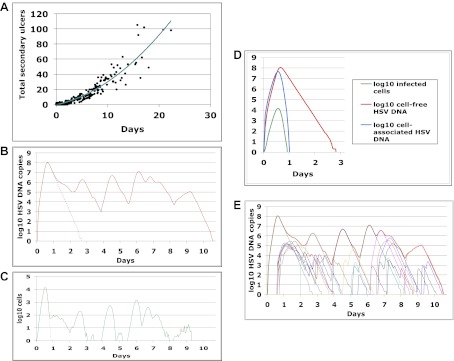
Herpes simplex virus-2 (HSV-2) is shed episodically, leading to occasional genital ulcers and efficient transmission. The biology explaining highly variable shedding patterns, in an infected person over time, is poorly understood. We sampled the genital tract for HSV DNA at several time intervals and concurrently at multiple sites, and derived a spatial mathematical model to characterize dynamics of HSV-2 reactivation. The model reproduced heterogeneity in shedding episode duration and viral production, and predicted rapid early viral expansion, rapid late decay, and wide spatial dispersion of HSV replication during episodes. In simulations, HSV-2 spread locally within single ulcers to thousands of epithelial cells in <12 hr, but host immune responses eliminated infected cells in <24 hr; secondary ulcers formed following spatial propagation of cell-free HSV-2, allowing for episode prolongation. We conclude that HSV-2 infection is characterized by extremely rapid virological growth and containment at multiple contemporaneous sites within genital epithelium. DOI:http://dx.doi.org/10.7554/eLife.00288.001.

Keywords: Herpes simplex; Human; Mathematical modeling; Mucosal immunity; Other; Viruses.


Conflict of interest statement

The authors declare that no competing interests exist.

Figures

Figure 1.
Figure 1.. HSV-2 levels in the genital tract are stable over minutes, expand and decay markedly over hours, and fluctuate rapidly and unpredictably over days.
(A) Shedding quantity in a participant, who performed genital swabs every 5 min over 4 hr during a lesion, reveals low swab-to-swab variation in viral quantity. Using data from panel (A and B), absolute mean difference (R2 = 0.99), and (C) mean difference (R2 = 0.87), in HSV DNA copies between swabs, are a function of time between swabs. (D) Shedding quantity in a participant, who performed 10 genital swabs per day during a lesion over 4 days (swabs every 2–4 hr), shows a characteristic saw-tooth pattern; arrows denote rapid viral re-expansion; the participant had a negative swab performed before episode onset. (E) Shedding quantity in a participant, who performed four genital swabs per day over 17 days demonstrates that rapid and frequent viral re-expansion allows for shedding prolongation; four missing data points are left blank. DOI: http://dx.doi.org/10.7554/eLife.00288.007
Figure 1—figure supplement 1.
Figure 1—figure supplement 1.. Dynamics of HSV-2 shedding over 5-min time intervals.
(A) and (B) Shedding quantity in two participants, who performed genital swabs every 5 min over 4 hr during a lesion, reveals low swab-to-swab variation in viral quantity. (C) Using data from panels (A and B), absolute mean difference in HSV DNA copies between swabs, correlated moderately with time between swabs in one participant (green line R2 = 0.60) due to steady viral decay, but was more stable as a function of time in the other participant due to peaking overall viral load (blue line, R2 = 0.16). (D) Using data from panels (A and B), mean difference in HSV DNA copies between swabs, was a function of time between swabs in the participants (green line R2 = 0.89, and blue line R2 = 0.85) presumably because viral load was generally decaying during most of the 4-hr window (green) or gradually expanding during most of the 4-hr window (blue). DOI: http://dx.doi.org/10.7554/eLife.00288.009
Figure 1—figure supplement 2.
Figure 1—figure supplement 2.. Dynamics of HSV-2 shedding with every 2-4 hr sampling.
Shedding quantity in four participants, who performed 10 genital swabs per day over 4–5 days during a lesion reveal a characteristic saw-tooth pattern; arrows denote re-expansion. Participants had swabbing initiated upon visualization of lesions. The participant in panel d initiated swabbing ∼16 hr after lesion detection. DOI: http://dx.doi.org/10.7554/eLife.00288.010
Figure 1—figure supplement 3.
Figure 1—figure supplement 3.. Dynamics of HSV-2 shedding with every 6-hr sampling over 8 days.
Shedding quantity in episodes detected in a participant who performed four genital swabs per day over 60 days demonstrates that viral re-expansion allows for shedding prolongation. DOI: http://dx.doi.org/10.7554/eLife.00288.011
Figure 2.
Figure 2.. HSV-2 replicates and is contained in widely dispersed microenvironments across the genital tract.
(A) HSV shedding quantity in a participant, who underwent daily swabs in 23 regions across the genital tract for 30 days; days without sampling are marked with an X; stars denote days with a lesion; virus is widely dispersed and several prolonged episodes with heterogeneous viral loads across the genital tract are noted. (B) Increasing probability of episode re-expansion (nonmonotonic episodes) as a function of peak episode copy number among 1020 episodes from 531 study subjects; individual peaks during episodes may represent virus from a single ulcer that can seed other regions. (C) A genital lesion consists of numerous round ulcers (black dotted circle) clustered in space; contemporaneous presence of multiple ulcers may indicate concurrent viral expansion in decay in multiple regions. (D) and (E) Immunofluorescent staining of biopsies performed (D) at the edge, and (E) 1 cm away from an ulcer 3 days post-healing; CD8+ T cells (green) at the dermal–epidermal junction (arrow) are highly localized to ulcer edge (287/mm2) and are fourfold less dense 1 cm away (72/mm2). DOI: http://dx.doi.org/10.7554/eLife.00288.013
Figure 2—figure supplement 1.
Figure 2—figure supplement 1.. Spatial features of HSV genital tract shedding.
HSV shedding quantity in a study participant, who underwent daily swabs in 23 regions across the genital tract for 30 days; days without sampling are marked with an X. The participant had three brief localized episodes with low viral copy number in three separate localized regions. DOI: http://dx.doi.org/10.7554/eLife.00288.015
Figure 2—figure supplement 2.
Figure 2—figure supplement 2.. Spatial features of HSV-2 lesions.
A genital lesion consists of numerous round ulcers or vesicles (black dotted circle), clustered in space. DOI: http://dx.doi.org/10.7554/eLife.00288.016
Figure 2—figure supplement 3.
Figure 2—figure supplement 3.. Spatial features of CD8+ T-cell response in genital skin.
Immunofluorescent staining of a biopsy performed (A) at the edge, and (B) 1 cm away from an ulcer 3 days post-healing. CD8+ T-cells (red) and CD4+ T-cells (green) at the dermal epidermal junction (arrow) are highly localized to ulcer edge (132/mm2 and 447/mm2, respectively), and are less dense 1 cm away (91/mm2 and 132/mm2, respectively). DOI: http://dx.doi.org/10.7554/eLife.00288.017
Figure 3.
Figure 3.. Mathematical model.
(A) Microregions are linked virally because cell-free HSV-2 can seed surrounding regions, and immunologically based on overlapping CD8+ T-cell densities between regions (not shown). (B) Schematic for HSV-2 infection within a single genital tract microenvironment. Equations capture seeding of epithelial cells by neuronal HSV-2, replication of HSV-2 within epithelial cells, viral spread to other epithelial cells, cytolytic CD8+ T-cell response to infected cells, transition of cell-associated HSV-2 to cell-free HSV-2 following lysis of infected cells, and elimination of free virus and infected cells. DOI: http://dx.doi.org/10.7554/eLife.00288.019
Figure 3—figure supplement 1.
Figure 3—figure supplement 1.. Spatial mathematical model.
Viruses produced from neurons (green), cell-associated viruses from epidermal cells (yellow), and cell-free viruses (orange) that form after rupture of epidermal cells, are distinguished in the model. Neuron-derived viruses are released throughout the genital tract and are responsible for ulcer initiation within specific regions (grey hexagons). Cell-associated HSV particles contribute to ulcer expansion (white circle) within a region. Cell-free particles initiate secondary ulcers in adjacent regions (upper right) leading to concurrent ulcers where HSV production occurs. Cytolytic CD8+ T-cell (purple circles) response is localized within each region. Regions have a maximum diameter of 6.5 mm. However, distance between regions is considered in terms of immunologic co-dependence rather than a physical distance. Seven of 300 total model regions are illustrated. DOI: http://dx.doi.org/10.7554/eLife.00288.020
Figure 4.
Figure 4.. The spatial model reproduces all shedding episode characteristics.
Colored bars represent results from (A) 14,685 genital swabs and (BG) 1020 shedding episodes from 531 study participants. The model simulation, represented with black bars in each panel, continued until 1020 episodes were generated; model sampling occurred every 24 hr as in the clinical protocol. Model output reproduced (A) quantitative shedding frequency as well as (B) rate, (C) median initiation to peak and peak to termination slopes, (D) Duration, (E) first HSV DNA copy number, (F) last HSV DNA copy number, and (G) peak HSV DNA copy number of episodes. DOI: http://dx.doi.org/10.7554/eLife.00288.021
Figure 4—figure supplement 1.
Figure 4—figure supplement 1.. Continuous sampling of spatial model output reveals more accurate measures of episode characteristics.
We subjected a 30-year simulation to daily and continuous sampling. (A) Median initiation to peak slope, and (B) peak to termination slopes increased substantially with continual sampling. (C) Shedding frequency was similar regardless of sampling frequency. (D) Continuous sampling detected 842 episodes (28.1/year) vs 450 episodes (15.0/year) with daily sampling. The 392 additional episodes were all less than a day in duration and mostly <104 peak HSV DNA copies per milliliter, skewing the distributions of (E) episode duration and (F) peak HSV DNA copy number. (G) Total number of episodes at low and high-peak copy numbers increased with continual sampling. DOI: http://dx.doi.org/10.7554/eLife.00288.023
Figure 5.
Figure 5.. Containment of infected cells within a single ulcer is extremely rapid, although secondary ulcers explain prolonged episodes.
(A) Episode duration was a function of the number of ulcers before episode termination during 500 simulated episodes. (B)–(E) A 10-day simulated episode consisting of 24 ulcers: (B) Total cell-free virus (red) over time reflects the saw-tooth pattern of prolonged episodes; virus produced from the initial ulcer (red dotted line) was eliminated within 3 days. (C) Infected cells were eliminated from the initial viral ulcer (green dotted line) within 1 day and there were four periods during the episode when no infected cells were present. (D) Cell-free virus (red), cell-associated virus (blue), and infected cells (green) were eliminated from the primary ulcer with different kinetics; infected cells peaked at 13 hr and were extinguished in <24 hr (E) Secondary ulcers prolonged episodes; each thin line represents HSV-2 production from a specific region. DOI: http://dx.doi.org/10.7554/eLife.00288.026
Figure 6.
Figure 6.. Random spatial dispersion of viral particles from neurons reproduced the full diversity of episode characteristics if particles were released continuously, daily, or weekly from neurons.
White circles represent results from (A) 14,685 genital swabs and (BG) 1020 shedding episodes from 531 study participants (Figure 4). The model simulations represented with colored bars in each panel continued until 1020 episodes were generated. Sampling occurred every 24 hr as in the clinical protocols. Model output with release of virus randomly throughout the 300 regions on a continuous (pink), daily (purple), every 3 days (blue), and weekly (orange) basis at an average rate of 82 HSV DNA particles per day reproduced (A) quantitative shedding frequency and episode, (B) rate, (C) median initiation to peak slope and peak to termination slopes, (D) Duration, (E) first HSV DNA copy number, (F) last HSV DNA copy number, and (G) peak HSV DNA copy number. DOI: http://dx.doi.org/10.7554/eLife.00288.036
Figure 6—figure supplement 1.
Figure 6—figure supplement 1.. Random spatial dispersion of viral particles from neurons reproduced the full diversity of episode characteristics during simulations in which particles were released into only a minority of the 300 modeled regions.
White circles represent results from (A) 14,685 genital swabs and (BG) 1020 shedding episodes from 531 study participants (Figure 4). The model simulations represented with colored bars in each panel continued until 1020 episodes were generated. Sampling occurred every 24 hr as in the clinical protocols. Model output with continuous release (82 HSV DNA particles per day) of virus randomly to 300 (pink), 100 (blue), and 50 (brown) regions reproduced (A) quantitative shedding frequency and episode, (B) rate, (C) median initiation to peak slope and peak to termination slopes, (D) Duration, (E) first HSV DNA copy number, (F) last HSV DNA copy number, and (G) peak HSV DNA copy number. Model output with continuous release (82 HSV DNA particles per day) of virus randomly to 20 (yellow), 5 (light blue), and 1 (red) region underestimated (A) quantitative shedding frequency and episode, (B) rate, (D) Duration, (E) first HSV DNA copy number, and (G) peak HSV DNA copy number. DOI: http://dx.doi.org/10.7554/eLife.00288.037
Figure 6—figure supplement 2.
Figure 6—figure supplement 2.. Dispersion of viral particles from neurons reproduced the full diversity of episode characteristics during simulations in which particles were released into a minority of modeled regions, provided that dispersion was random rather than clustered within a single geographic region.
White circles represent results from (A) 14,685 genital swabs and (BG) 1020 shedding episodes from 531 study participants (Figure 4). The model simulations represented with colored bars in each panel continued until 1020 episodes were generated. Sampling occurred every 24 hr as in the clinical protocols. Model output with continuous release (82 HSV DNA particles per day) of virus to 50 randomly dispersed regions (brown) reproduced (A) quantitative shedding frequency and episode, (B) rate, (C) median initiation to peak slope and peak to termination slopes, (D) Duration, (E) first HSV DNA copy number, (F) last HSV DNA copy number, and (G) peak HSV DNA copy number. Model output with continuous release (82 HSV DNA particles per day) of virus to 50 clustered regions (green) underestimated (A) shedding frequency due only to (B) too low of an episode rate with daily sampling. DOI: http://dx.doi.org/10.7554/eLife.00288.038

References

    1. Bauer AL, Beauchemin CA, Perelson AS. 2009. Agent-based modeling of host-pathogen systems: the successes and challenges. Inf Sci (Ny) 179:1379–89 doi: 10.1016/j.ins.2008.11.012 - DOI - PMC - PubMed
    1. Ciupe SM, Ribeiro RM, Nelson PW, Perelson AS. 2007. Modeling the mechanisms of acute hepatitis B virus infection. J Theor Biol 247:23–35 doi: 10.1016/j.jtbi.2007.02.017 - DOI - PMC - PubMed
    1. Collins WJ, Johnson DC. 2003. Herpes simplex virus gE/gI expressed in epithelial cells interferes with cell-to-cell spread. J Virol 77:2686–95 doi: 10.1128/JVI.77.4.2686-2695.2003 - DOI - PMC - PubMed
    1. Corey L, Adams HG, Brown ZA, Holmes KK. 1983. Genital herpes simplex virus infections: clinical manifestations, course, and complications. Ann Intern Med 98:958–72 - PubMed
    1. Crespi C, Cumberland W, Wald A, Corey L, Blower S. 2007. Longitudinal study of herpes simplex virus type 2 infection using viral dynamic modelling. Sex Transm Infect 83:359–64 doi: 10.1136/sti.2006.022020 - DOI - PMC - PubMed

Publication types