. 2013:2013:374170.
doi: 10.1155/2013/374170. Epub 2013 Mar 27.

MR Imaging of Hepatocellular Adenomas and Differential Diagnosis Dilemma

Affiliations

MR Imaging of Hepatocellular Adenomas and Differential Diagnosis Dilemma

Luigi Grazioli et al. Int J Hepatol. 2013.

Abstract

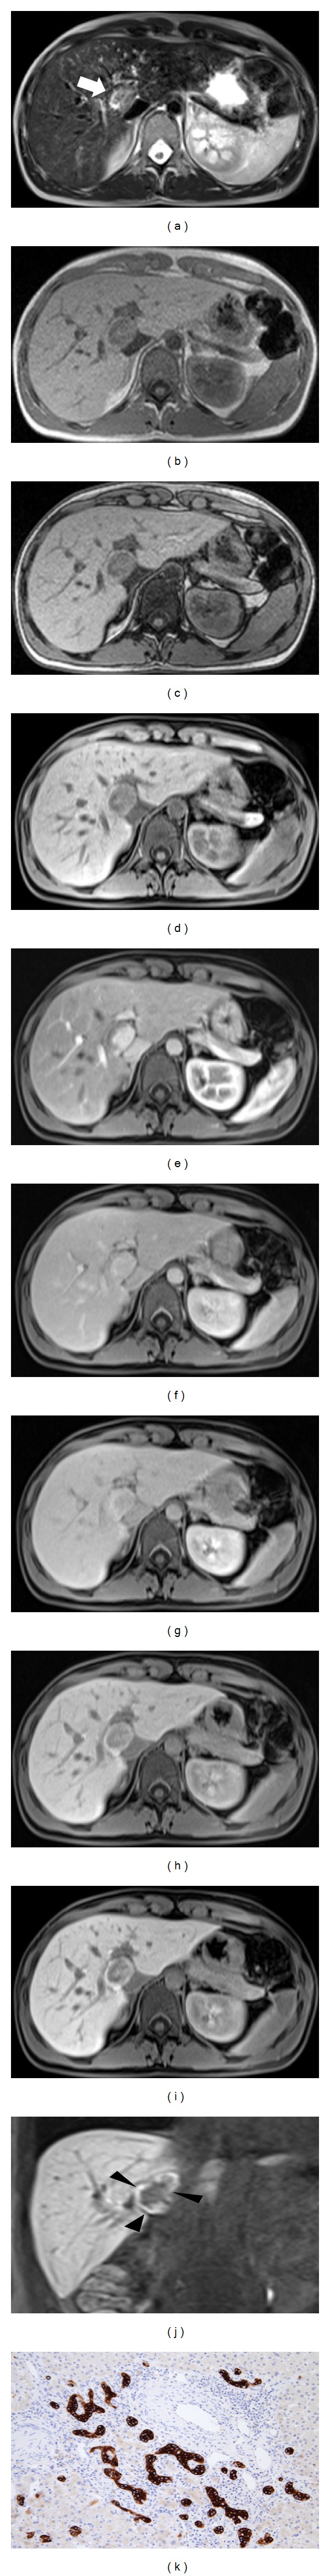
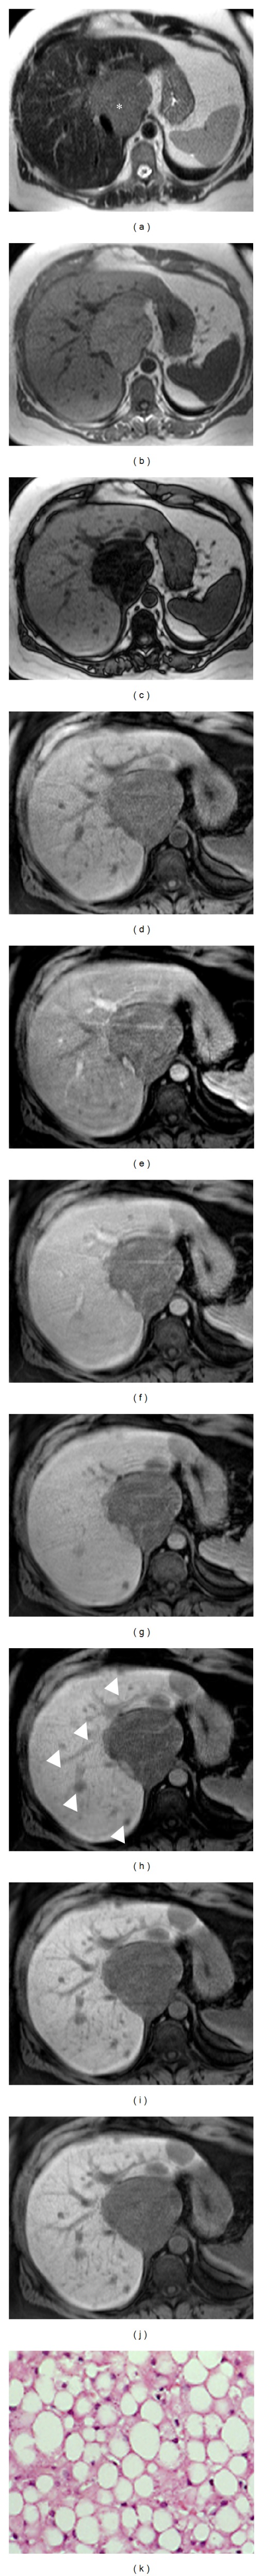
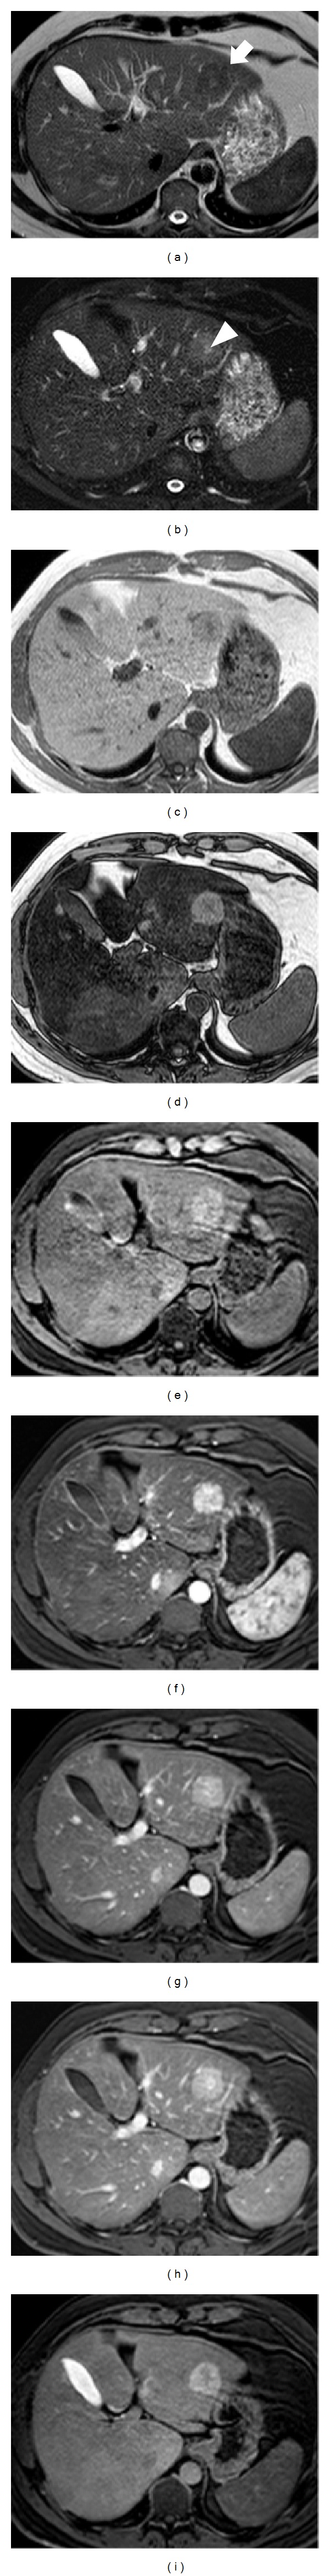
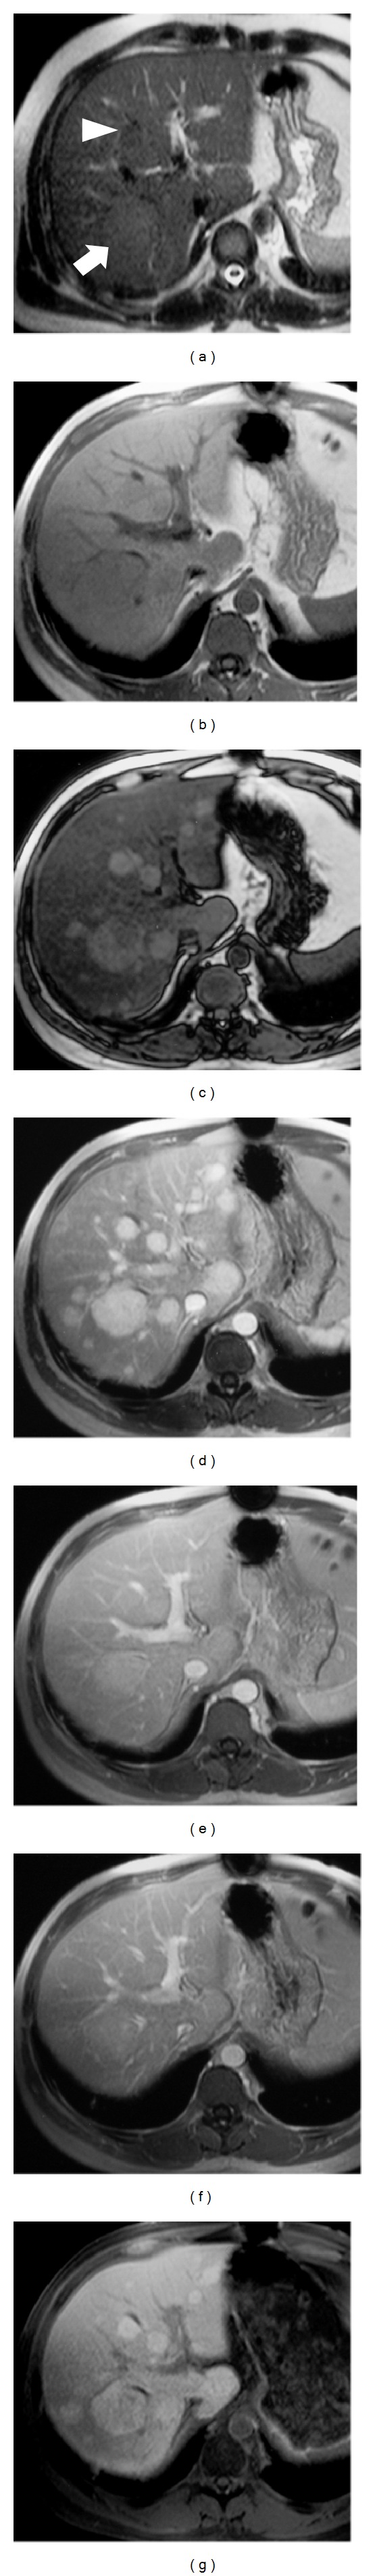
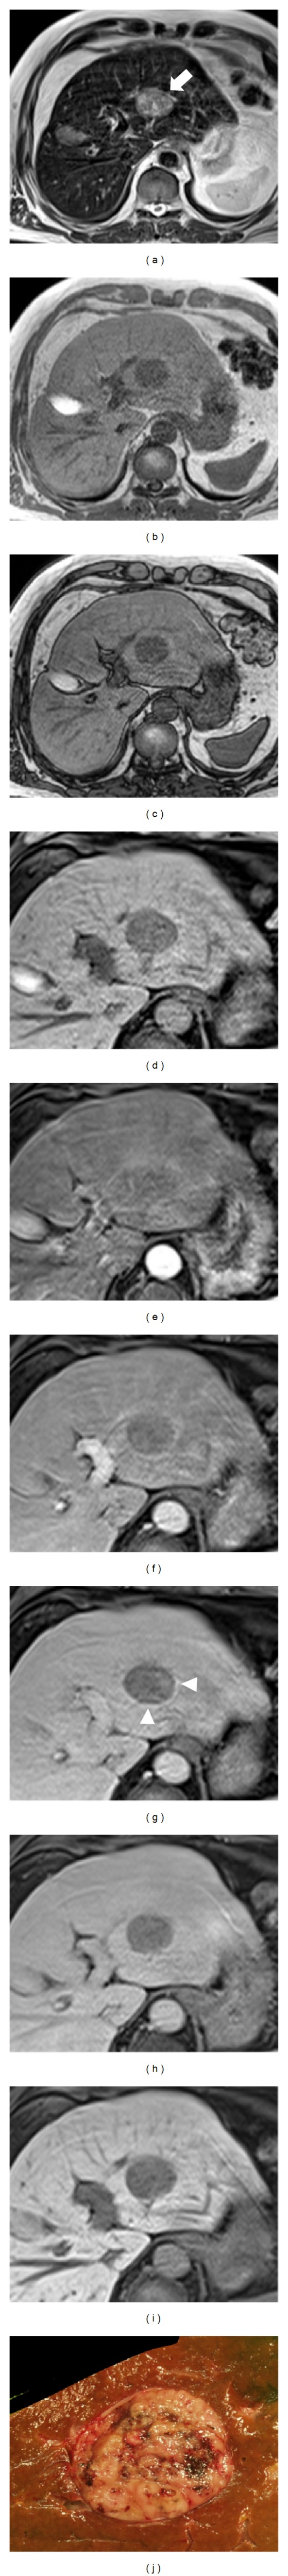
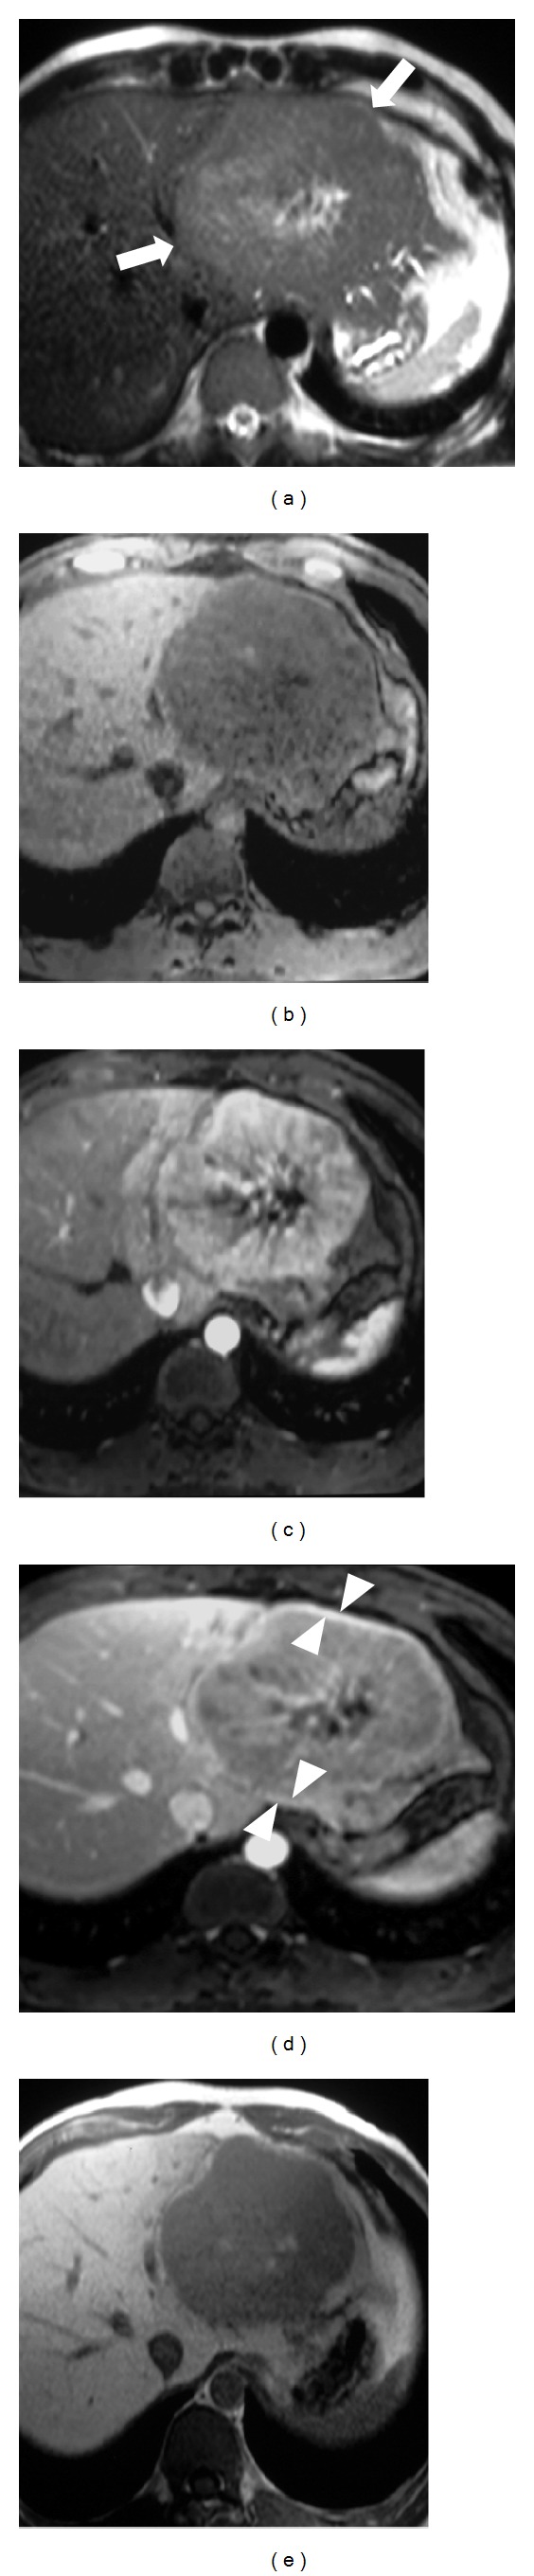
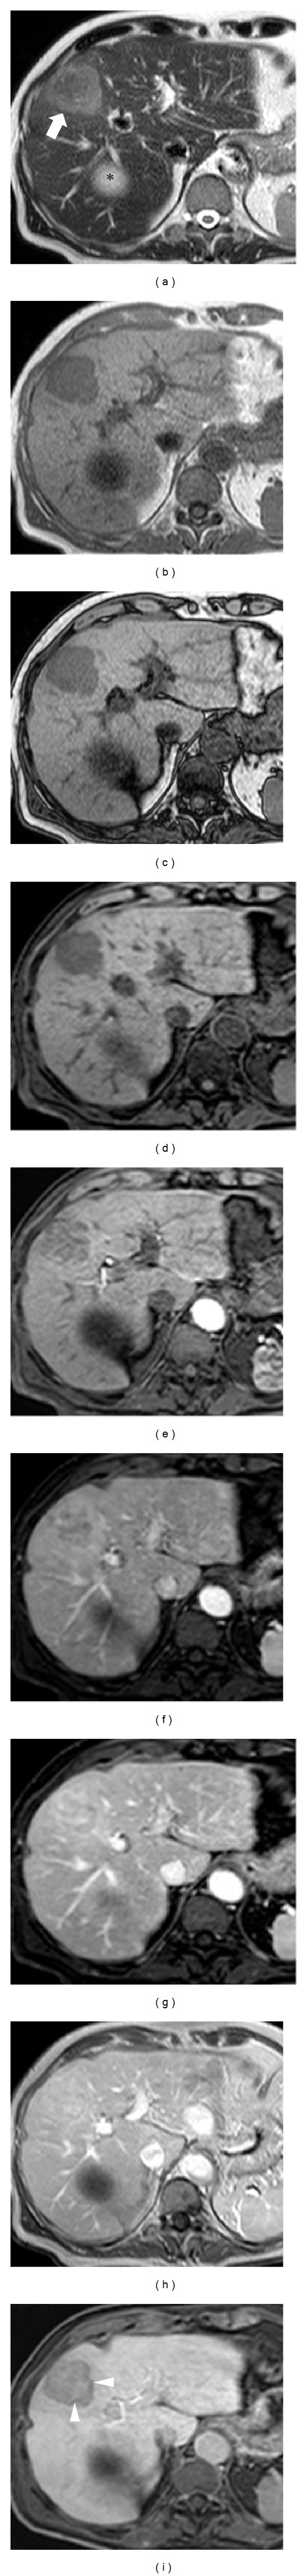
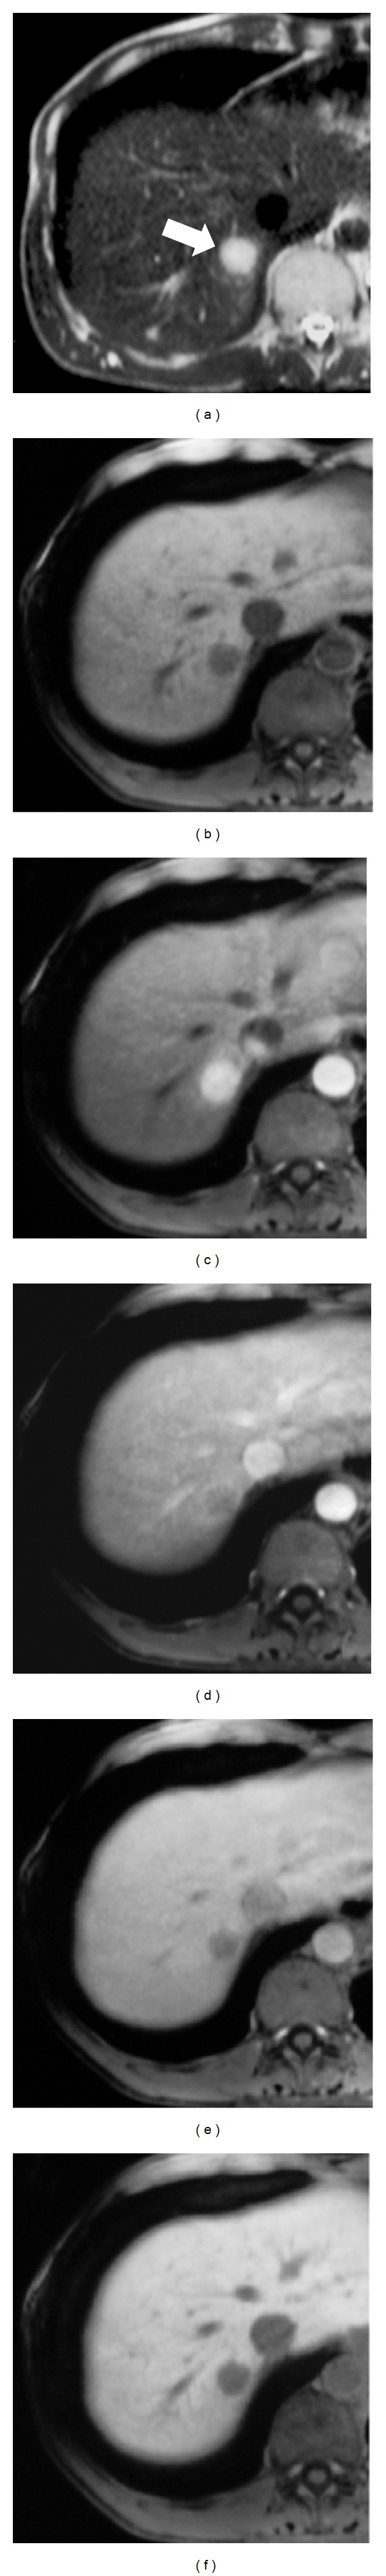
HEPATOCELLULAR ADENOMAS (HCAS) ARE CURRENTLY CATEGORIZED INTO DISTINCT GENETIC AND PATHOLOGIC SUBTYPES AS FOLLOWS: inflammatory hepatocellular adenoma, hepatocyte-nuclear-factor-1-alpha (HNF-1 α -mutated) hepatocellular adenoma, and β -catenin-mutated hepatocellular adenomas; the fourth, defined as unclassified subtype, encompasses HCAs without any genetic abnormalities. This classification has accepted management implications due to different risks of haemorrhage and malignant transformation of the four subtypes. Imaging guided biopsy and/or surgical resection very important in obtaining definitive characterization; nevertheless, MRI with intra-extravascular and hepatobiliary (dual phase) agents, is an important tool not only in differential subtypes definition but even in surveillance with early identification of complications and discovery of some signs of HCA malignant degeneration. Inflammation, abnormal rich vascularisation, peliotic areas, and abundant fatty infiltration are pathologic findings differently present in the HCA subtypes and they may be detected by multiparametric MRI approach. Lesion enlargement and heterogeneity of signal intensity and of contrast enhancement are signs to be considered in malignant transformation. The purpose of this paper is to present the state of the art of MRI in the diagnosis of HCA and subtype characterization, with particular regard to morphologic and functional information available with dual phase contrast agents, and to discuss differential diagnosis with the most common benign and malignant lesions mimicking HCAs.


Figures

Figure 1
Figure 1
Inflammatory adenoma and focal nodular hyperplasia. (a) Axial T2w fat-suppressed image. In Segment (S) VII homogeneous well-delineated hyperintense adenoma (arrow), proven by biopsy. In SI, note a second isointense lesion, focal nodular hyperplasia (arrowhead). (b-c) T1w in- and out-phased images. Both lesions are mainly isointense. (d–i) DWI sequences. Adenoma (arrow in d) is constantly hyperintense. Conversely FNH (arrowhead in d) is isointense. ADC map (i) both lesions are is slightly hyperintense. (j–n) In dynamic evaluation after Gd-EOB-DTPA administration adenoma shows intense enhancement in arterial phase (k) with washout in portal (l) and equilibrium (m) phases; conversely, FNH shows progressive increase of the signal. (o-p) In hepatobiliary phases after 10′ (o) and 20′ (p), adenoma is hypointense relative to the adjacent liver parenchyma and FHN is hyperintense. (o) Histology shows hepatocytes arranged in plates that are two to three cells thick separated by sinusoids.
Figure 2
Figure 2
Inflammatory adenoma with “atoll sign.” (a) In S IX well-delineated slightly hyperintense lesion with hyperintense peripheral rim (arrow) in axial T2w image. (b-c) T1w in- and out-phased images. The mass is hypointense relative to the hepatic parenchyma with isointense rim. (d–h) In dynamic evaluation after Gd-EOB-DTPA administration the lesion shows marked central enhancement in arterial phase (e) with slight wash out in portal (f) and more evident equilibrium (g) phases. After 5′ (h) the nodule is mainly hypointense. Conversely, the peripheral component of the nodule demonstrates progressive enhancement over time. (i-j) In hepatobiliary phases after 20′, axial (i) and coronal (j), the lesion is heterogeneously hypointense in the central portion and hyperintense at the periphery (arrowheads). Final diagnosis was obtained by biopsy. Histology demonstrates ductal reaction at the periphery of the lesion (k).
Figure 3
Figure 3
Atypical inflammatory adenoma. (a) In S VI homogeneous well-delineated isointense lesion in axial T2w fat-suppressed image (arrow). (b-c) T1w in- and out-phased images. The mass is isointense relative to the hepatic parenchyma. Note large vessels at the periphery of the lesion (arrowheads). (d–g) DWI sequences. The lesion does not show any increase of signal intensity from 50 (d) to 400 (e) and to 800 (f) b values. IN ADC map (g) the nodule shows isointense signal. (h–l) In dynamic evaluation after Gd-EOB-DTPA administration the mass shows discrete enhancement in arterial phase (i) with slightly wash out in portal (j) and equilibrium (k) phases. After 5′ (l) the nodule is more hypointense. (m-n) In hepatobiliary phases after 10′ (m) and 20′ (n), the lesion is definitively heterogeneously hypointense relative to the adjacent liver parenchyma with exophytic growth. (o) Cut section shows large capsulated homogeneous mass. (p) Microscopically, significant sinusoidal dilatation (arrowheads), polymorphous inflammatory infiltrates (star), areas of peliosis, and thickened tortuous arteries (arrow) are demonstrated.
Figure 4
Figure 4
HNF-1α-mutated adenomas. (a) Axial T2w images without fat suppression. In S I and S II multiple slightly homogeneous hyperintense lesions (asterisk indicates the largest nodule biopsied). (b-c) T1w in- and out-phased images. Due to significant intralesional presence of fat tissue, the nodules show signal drop with variable degree in c. (d–h) In dynamic evaluation after Gd-EOB-DTPA administration the nodules show poor enhancement. In (h), after 5′ the nodules are more hypointense; other lesions may be detected in both hepatic lobes (arrowheads). (i-j) In hepatobiliary phases after 10′ (i) and 20′ (j), all adenomas are hypointense relative to adjacent liver parenchyma. (k) Histology confirms presence of fat-rich hepatocytes.
Figure 5
Figure 5
β-catenin-mutated adenoma. (a) In S VI heterogeneous well delineated hyperintense lesion (arrows). (b-c) T1w in- and out-phased images. The mass is slightly hypointense relative to hepatic parenchyma with focal signal drop due to intralesional fatty infiltration (arrowhead). (d–g) DWI sequences. The lesion increases signal intensity from 50 (d) to 400 (e) and to 800 (f) b values. In ADC map (g) the nodule shows heterogeneous signal. (h–l) In dynamic evaluation after Gd-EOB-DTPA administration the mass shows intense heterogeneous enhancement in arterial phase (i) without evident wash out in portal (j) and (k) equilibrium phases. (l-m) In hepatobiliary phases after 10′ (l) and 20′ (m), the lesions are heterogeneous hypointense relative to the adjacent liver parenchyma. (n-o) Gross specimen confirms capsulated heterogeneous mass with fatty component (arrowheads).
Figure 6
Figure 6
Bleeding adenoma in young man with sudden and acute upper abdominal pain. (a-b) Ultrasound, B-mode (a) and color-Doppler (b) imaging show heterogeneous lesion without significant vascularization. (c–f) CT confirms heterogeneous hyperdense bleeding mass with persistent vascularized tissue in the lower portion of the lesion (arrowheads). (g) Axial T2w image shows mixed heterogenous bleeding capsulated mass (arrows) in S VIII. (h-i) T1w in- and out-phased images confirm intralesional hemorrhage. (j–m) MR dynamic study shows vascularized tissue in the lower portion of the lesion (arrowheads). (n–p) DSA before embolization. Note hypervascular tissue in the lower part of the lesion (arrow). (q-r) DSA after embolization, complete devascularization of the nodule. (s) Cut section of the resected lesion shows large hemorrhagic component (star).
Figure 7
Figure 7
Focal nodular hyperplasia in fatty liver. (a-b) Axial T2w images without (a) and with (b) fat suppression. In S II slightly hypointense (a) and hyperintense (b) lesions (arrow) with hyperintense central scar (arrowhead). (c-d) Due to significant steatosis of hepatic parenchyma the lesion is hypo- and hyperintense in T1w in- and out-phased images. (e–h) In dynamic evaluation after Gd-BOPTA administration the nodule appears significantly hypervascular in arterial phase (f) and tends to be hyperintense in portal and equilibrium phases. Typically central scar becomes hyperintense in equilibrium phase. (i) Hepatobiliary phase image after 1 hour. The lesion is hyperintense except central scar which is hypointense with stellate aspect.
Figure 8
Figure 8
Large regenerative hyperplasia. (a) Axial T2w image. In S VII slightly hyperintense nodule (arrow); in SIV moderate hypointense lesion (arrowhead). (b-c) T1w in- and out-phased images. Due to significant steatosis of hepatic parenchyma after chemotherapy, many other hypointense lesions appear in out-phased sequence. (d–f) In dynamic evaluation after Gd-BOPTA administration the nodules appear significantly hypervascular in arterial phase (d) and tend to be isointense in portal and equilibrium phases. (g) Hepatobiliary phase image after 1 hour. Nodules are hyperintense.
Figure 9
Figure 9
HCC in noncirrhotic liver. (a) Axial T2w image. In S II-S III slightly hyperintense well delineated lesion (arrow). (b-c) In T1w in- and out-phased images of the lesion appears hypointense. (d–h) In dynamic evaluation after Gd-EOB-DTPA administration the nodule appears slightly hypervascular in arterial phase (e); it shows rapid and progressive wash out in portal and equilibrium phases. Note the presence of a pseudocapsule (arrowhead) in equilibrium phase. (i) Hepatobiliary phase image after 20′. The lesion appears hypointense. (j) Pathologic specimen confirms the presence of HCC nodule in normal liver.
Figure 10
Figure 10
Fibrolamellar HCC. (a) Axial T2w image. In left lobe slightly well delineated mass (arrows) with heterogeneous central area. (b–d) In dynamic evaluation after Gd-BOPTA the lesion appears markedly heterogeneous hypervascular in arterial phase (c); it shows rapid and progressive wash out in portal phase. The central area is hypointense. Note complete thick pseudocapsule at the periphery (arrowhead). (e) In hepatobiliary phase image the lesion is hypointense; the central fibrotic component retains contrast agent.
Figure 11
Figure 11
Peripheral CCC. (a) Axial T2w image. In S IV slightly heterogeneous hyperintense lobulated lesion (arrow); cyst (asterisk). (b-c) T1w in- and out-phased images. The lesion appears hypointense. (d–h) In dynamic evaluation after GD-BOPTA administration the nodule appears slightly heterogeneous hypervascular in arterial phase (e) with progressive enhancement in portal and equilibrium phases. After 5′ (h) note persistent enhancement and peripheral wash out. (i) Epatobiliary phase image after 1 h. The lesion appears hypointense, showing central pooling and more evident peripheral wash out (arrowheads).
Figure 12
Figure 12
Primary hepatic NH lymphoma. (a) On T2w image well-defined homogeneous moderate hyperintense nodule (asterisk) in S VII. (b-c) T1w in- and out-phased images. The lesion appears homogeneously moderate hypointense on T1w sequences. (d–g) On contrast enhanced MRI the mass shows homogeneous hypervascular enhancement in arterial phase (e) and becomes isointense to liver parenchyma on portal and late dynamic phases. (h) In epatobiliary phase the nodule is homogeneously hypointense.
Figure 13
Figure 13
Neuroendocrine hepatic metastasis. (a) On T2w image well-defined homogeneous markedly hyperintense nodule (arrow) in S VII. (b–e) On precontrast T1w fat sat images the lesion is hypointense (b). On contrast enhanced MRI the nodule shows homogeneous evident enhancement in arterial phase (c) with rapid wash out in portal phase, more evident in equilibrium phase. (f) In epatobiliary phase, 10' after GD-EOB-DTPA, the nodule is hypointense.

Similar articles

Cited by

References

    1. La Vecchia C, Tavani A. Female hormones and benign liver tumours. Digestive and Liver Disease. 2006;38(8):535–536. - PubMed
    1. Prentice RL. Epidemiologic data on exogenous hormones and hepatocellular carcinoma and selected other cancers. Preventive Medicine. 1991;20(1):38–46. - PubMed
    1. Labrune P, Trioche P, Duvaltier I, Chevalier P, Odièvre M. Hepatocellular adenomas in glycogen storage disease type I and III: a series of 43 patients and review of the literature. Journal of Pediatric Gastroenterology and Nutrition. 1997;24(3):276–279. - PubMed
    1. Giannitrapani L, Soresi M, La Spada E, Cervello M, D’Alessandro N, Montalto G. Sex hormones and risk of liver tumor. Annals of the New York Academy of Sciences. 2006;1089:228–236. - PubMed
    1. Cappell MS. Hepatic disorders severely affected by pregnancy: medical and obstetric management. Medical Clinics of North America. 2008;92(4):739–760. - PubMed

LinkOut - more resources