

Hypoxia alters ocular drug transporter expression and activity in rat and calf models: implications for drug delivery
- PMID: 23607566
- PMCID: PMC3973437
- DOI: 10.1021/mp3007133
Hypoxia alters ocular drug transporter expression and activity in rat and calf models: implications for drug delivery
Retraction in
-
Retraction of "Hypoxia Alters Ocular Drug Transporter Expression and Activity in Rat and Calf Models: Implications for Drug Delivery".Mol Pharm. 2015 Jul 6;12(7):2559. doi: 10.1021/acs.molpharmaceut.5b00367. Epub 2015 Jun 1. Mol Pharm. 2015. PMID: 26027647 Free PMC article. No abstract available.
Abstract
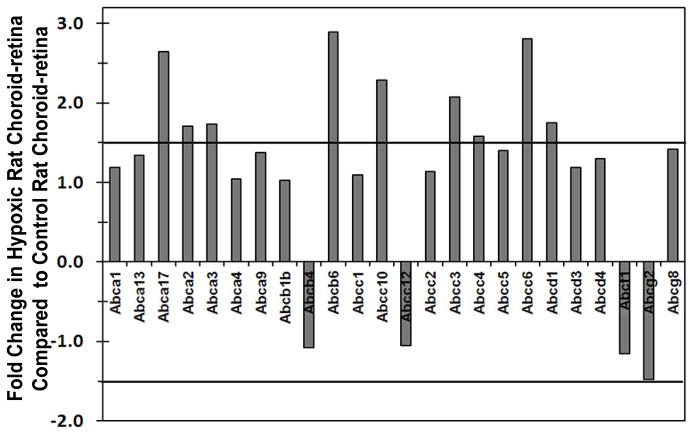
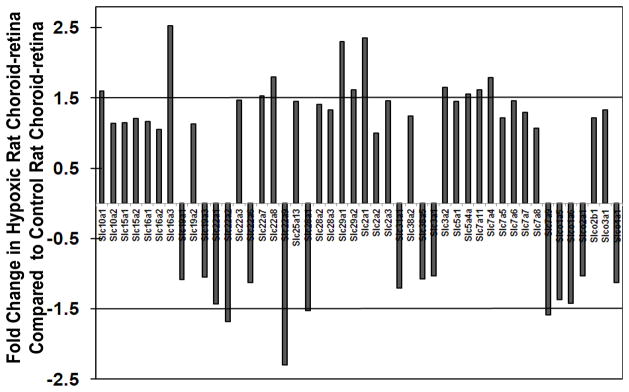
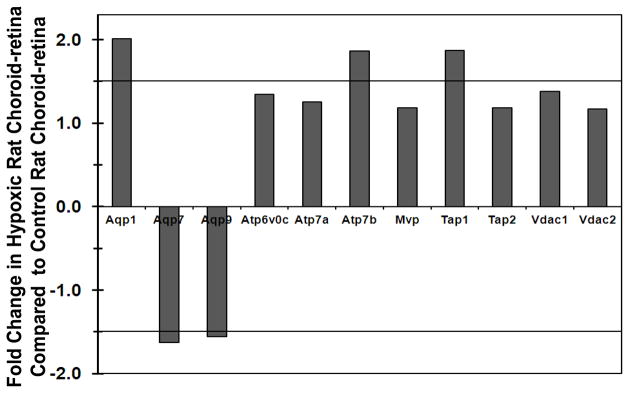
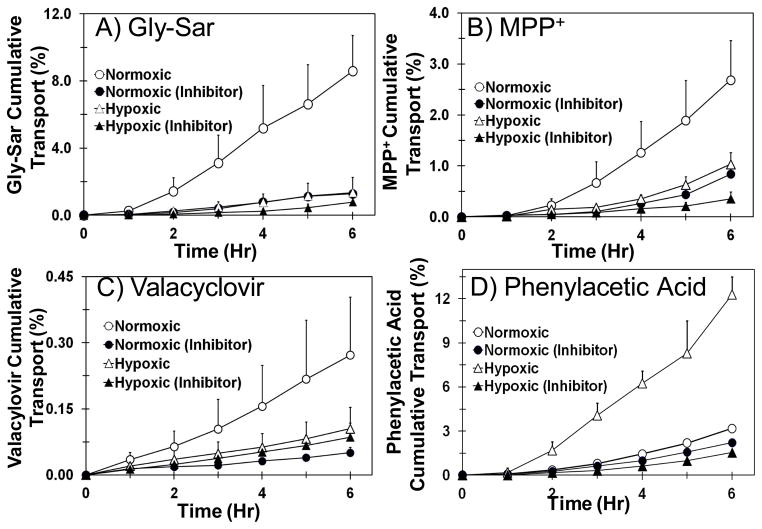
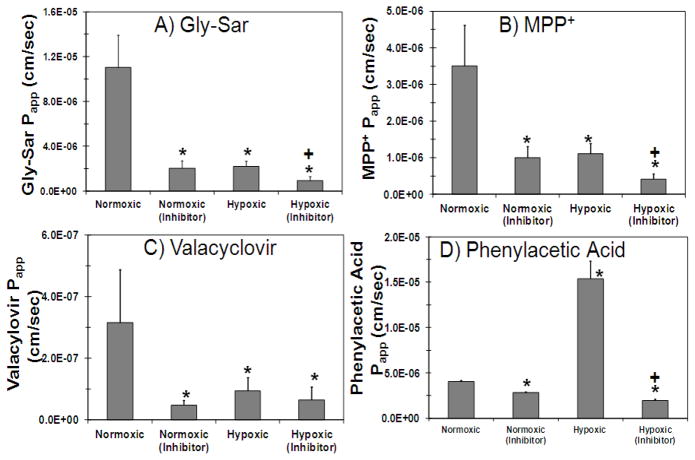
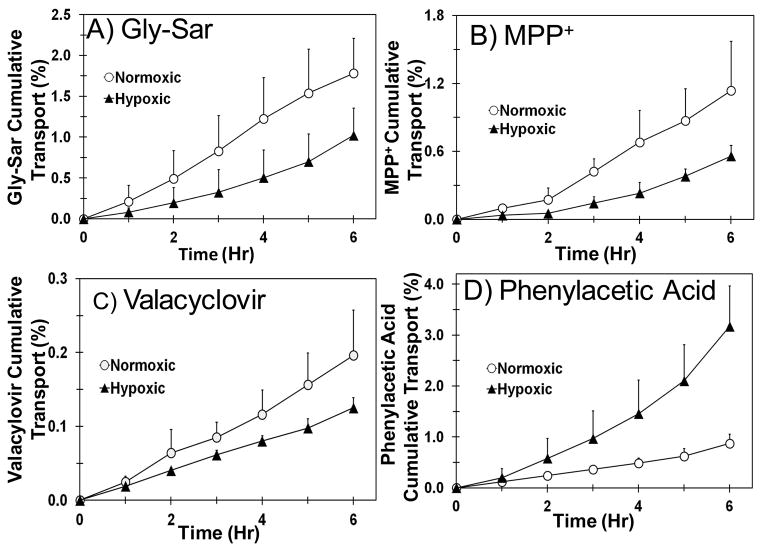
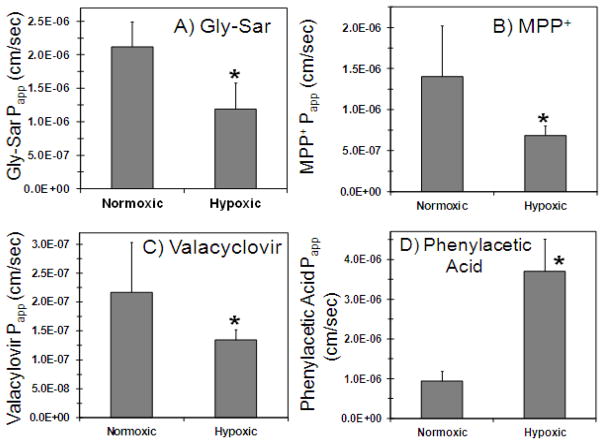
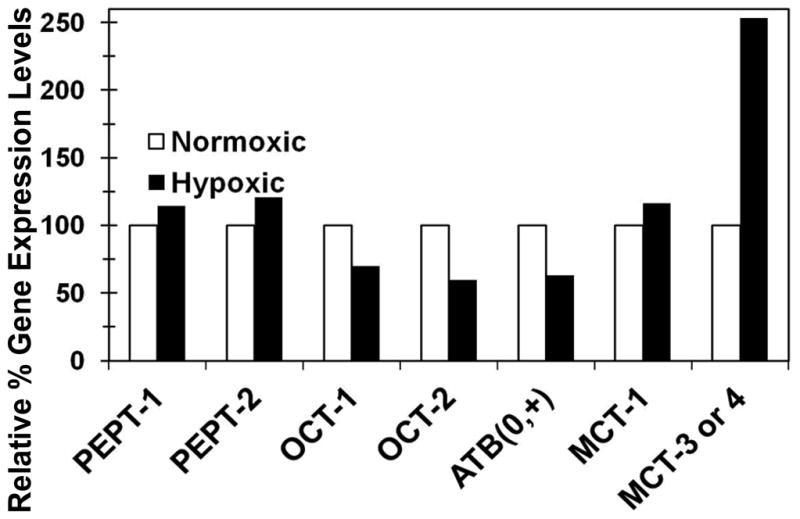
Chronic hypoxia, a key stimulus for neovascularization, has been implicated in the pathology of proliferative diabetic retinopathy, retinopathy of prematurity, and wet age related macular degeneration. The aim of the present study was to determine the effect of chronic hypoxia on drug transporter mRNA expression and activity in ocular barriers. Sprague-Dawley rats were exposed to hypobaric hypoxia (PB = 380 mmHg) for 6 weeks, and neonatal calves were maintained under hypobaric hypoxia (PB = 445 mmHg) for 2 weeks. Age matched controls for rats, and calves were maintained at ambient altitude and normoxia. The effect of hypoxia on transporter expression was analyzed by qRT-PCR analysis of transporter mRNA expression in hypoxic and control rat choroid-retina. The effect of hypoxia on the activity of PEPT, OCT, ATB(0+), and MCT transporters was evaluated using in vitro transport studies of model transporter substrates across calf cornea and sclera-choroid-RPE (SCRPE). Quantitative gene expression analysis of 84 transporters in rat choroid-retina showed that 29 transporter genes were up regulated or down regulated by ≥1.5-fold in hypoxia. Nine ATP binding cassette (ABC) families of efflux transporters including MRP3, MRP4, MRP5, MRP6, MRP7, Abca17, Abc2, Abc3, and RGD1562128 were up-regulated. For solute carrier family transporters, 11 transporters including SLC10a1, SLC16a3, SLC22a7, SLC22a8, SLC29a1, SLC29a2, SLC2a1, SLC3a2, SLC5a4, SLC7a11, and SLC7a4 were up regulated, while 4 transporters including SLC22a2, SLC22a9, SLC28a1, and SLC7a9 were down-regulated in hypoxia. Of the three aquaporin (Aqp) water channels, Aqp-9 was down-regulated, and Aqp-1 was up-regulated during hypoxia. Gene expression analysis showed down regulation of OCT-1, OCT-2, and ATB(0+) and up regulation of MCT-3 in hypoxic rat choroid-retina, without any effect on the expression of PEPT-1 and PEPT-2. Functional activity assays of PEPT, OCT, ATB(0+), and MCT transporters in calf ocular tissues showed that PEPT, OCT, and ATB(0+) functional activity was down-regulated, whereas MCT functional activity was up-regulated in hypoxic cornea and SCRPE. Gene expression analysis of these transporters in rat tissues was consistent with the functional transport assays except for PEPT transporters. Chronic hypoxia results in significant alterations in the mRNA expression and functional activity of solute transporters in ocular tissues.
Figures
Comment in
-
Findings of Research Misconduct.Fed Regist. 2018 Dec 6;83(234):62875. Fed Regist. 2018. PMID: 30556543 Free PMC article. No abstract available.
Similar articles
-
Immunohistochemical and functional characterization of peptide, organic cation, neutral and basic amino acid, and monocarboxylate drug transporters in human ocular tissues.Drug Metab Dispos. 2013 Feb;41(2):466-74. doi: 10.1124/dmd.112.045674. Epub 2012 Nov 20. Drug Metab Dispos. 2013. Retraction in: Drug Metab Dispos. 2015 Feb;43(2):234. doi: 10.1124/dmd.114.045674err. PMID: 23169611 Free PMC article. Retracted.
-
Transporter targeted gatifloxacin prodrugs: synthesis, permeability, and topical ocular delivery.Mol Pharm. 2012 Nov 5;9(11):3136-46. doi: 10.1021/mp300245r. Epub 2012 Oct 11. Mol Pharm. 2012. PMID: 23003105 Free PMC article.
-
Subcellular localization of transporters along the rat blood-brain barrier and blood-cerebral-spinal fluid barrier by in vivo biotinylation.Neuroscience. 2008 Aug 13;155(2):423-38. doi: 10.1016/j.neuroscience.2008.06.015. Epub 2008 Jun 13. Neuroscience. 2008. PMID: 18619525
-
The role of blood-ocular barrier transporters in retinal drug disposition: an overview.Expert Opin Drug Metab Toxicol. 2010 Sep;6(9):1111-24. doi: 10.1517/17425255.2010.486401. Expert Opin Drug Metab Toxicol. 2010. PMID: 20438316 Review.
-
[Membrane Transporters and Their Regulatory Mechanisms at the Brain and Retinal Barriers to Establish Therapies for Refractory Central Nervous System Diseases].Yakugaku Zasshi. 2020;140(10):1235-1242. doi: 10.1248/yakushi.20-00127. Yakugaku Zasshi. 2020. PMID: 32999202 Review. Japanese.
Cited by
-
Development of a Bioinformatics Framework for Identification and Validation of Genomic Biomarkers and Key Immunopathology Processes and Controllers in Infectious and Non-infectious Severe Inflammatory Response Syndrome.Front Immunol. 2020 Mar 31;11:380. doi: 10.3389/fimmu.2020.00380. eCollection 2020. Front Immunol. 2020. PMID: 32318053 Free PMC article.
-
Drug transporters in the central nervous system.Clin Pharmacokinet. 2015 Mar;54(3):225-42. doi: 10.1007/s40262-015-0241-y. Clin Pharmacokinet. 2015. PMID: 25647629 Review.
-
Imidazole-based alkaloid derivative LCB54-0009 suppresses ocular angiogenesis and lymphangiogenesis in models of experimental retinopathy and corneal neovascularization.Br J Pharmacol. 2015 Aug;172(15):3875-89. doi: 10.1111/bph.13177. Epub 2015 Jun 26. Br J Pharmacol. 2015. PMID: 25917462 Free PMC article.
-
Effects of Electromagnets on Bovine Corneal Endothelial Cells Treated with Dendrimer Functionalized Magnetic Nanoparticles.Polymers (Basel). 2021 Sep 28;13(19):3306. doi: 10.3390/polym13193306. Polymers (Basel). 2021. PMID: 34641122 Free PMC article.
References
-
- Tachikawa M, Hosoya K, Ohtsuki S, Terasaki T. A novel relationship between creatine transport at the blood-brain and blood-retinal barriers, creatine biosynthesis, and its use for brain and retinal energy homeostasis. In: Salomons GS, Wyss M, editors. Creatine and Creatine Kinase in Health and Disease. 1. Springer; The Netherlands: 2007. pp. 83–98. - PubMed
-
- Cunha-Vaz JG. The blood-retinal barriers system. Basic concepts and clinical evaluation. Exp Eye Res. 2004;78(3):715–21. - PubMed
-
- Tomi M, Hosoya K. The role of blood-ocular barrier transporters in retinal drug disposition: an overview. Expert Opin Drug Metab Toxicol. 2010;6(9):1111–24. - PubMed
-
- Grimm C, Willmann G. Hypoxia in the eye: a two-sided coin. High Alt Med Biol. 2012;13(3):169–75. - PubMed
-
- Leonard R, Gordon AR. Statistics on Vision Impairment A Resource Manual. Research Institute of Lighthouse International; 2002. pp. 1–49.
Publication types
MeSH terms
Substances
Grants and funding
LinkOut - more resources
Full Text Sources
Other Literature Sources
Research Materials
Miscellaneous
