Comparative Study
. 2013 Jul 17;4(7):1049-56.
doi: 10.1021/cn400065k. Epub 2013 Apr 29.

Visualizing neurotransmitters and metabolites in the central nervous system by high resolution and high accuracy mass spectrometric imaging

Affiliations
Comparative Study

Visualizing neurotransmitters and metabolites in the central nervous system by high resolution and high accuracy mass spectrometric imaging

Hui Ye et al. ACS Chem Neurosci. .

Abstract

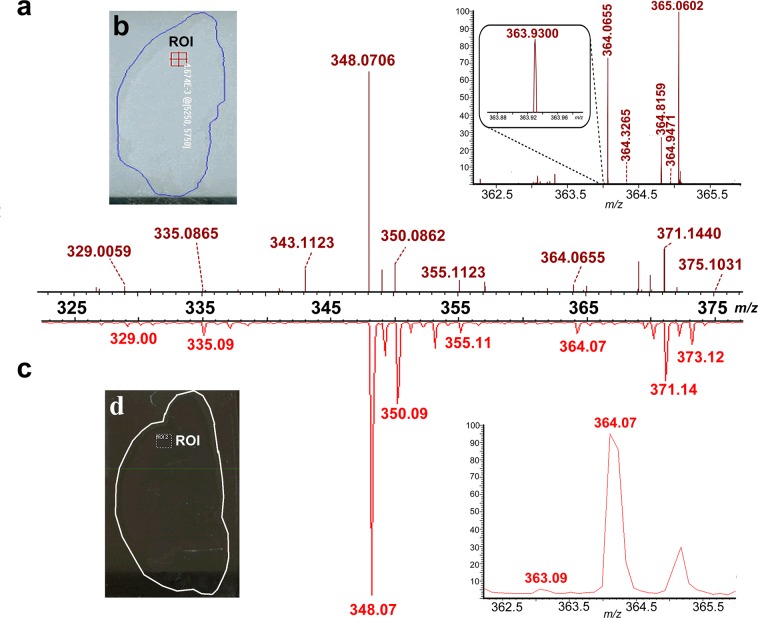
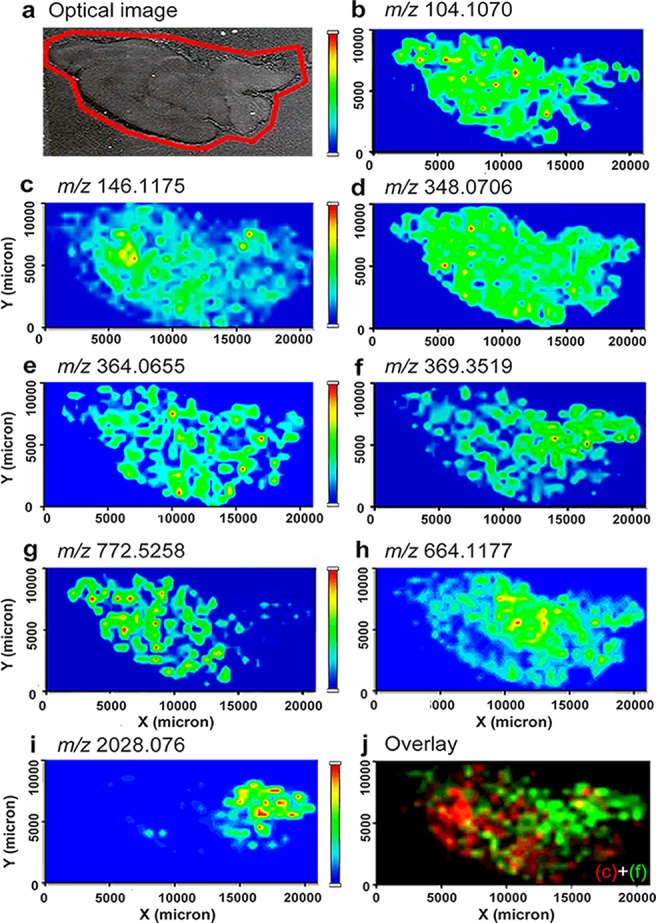
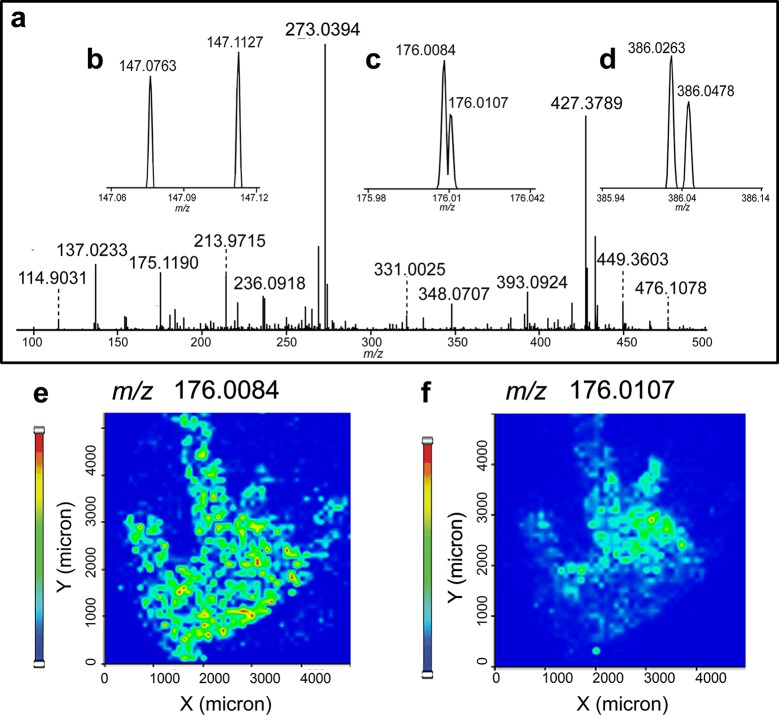
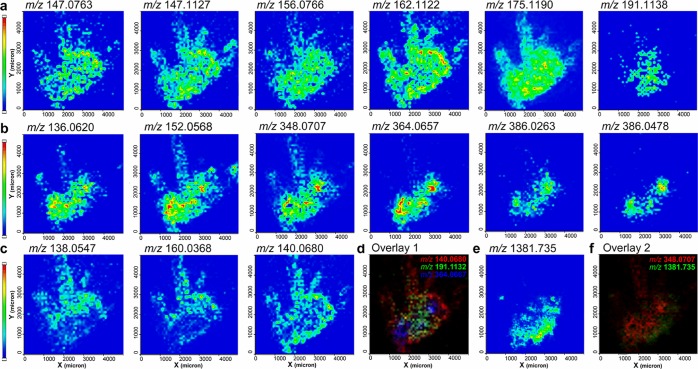
The spatial localization and molecular distribution of metabolites and neurotransmitters within biological organisms is of tremendous interest to neuroscientists. In comparison to conventional imaging techniques such as immunohistochemistry, matrix-assisted laser desorption/ionization (MALDI) mass spectrometric imaging (MSI) has demonstrated its unique advantage by directly localizing the distribution of a wide range of biomolecules simultaneously from a tissue specimen. Although MALDI-MSI of metabolites and neurotransmitters is hindered by numerous matrix-derived peaks, high-resolution and high-accuracy mass spectrometers (HRMS) allow differentiation of endogenous analytes from matrix peaks, unambiguously obtaining biomolecular distributions. In this study, we present MSI of metabolites and neurotransmitters in rodent and crustacean central nervous systems acquired on HRMS. Results were compared with those obtained from a medium-resolution mass spectrometer (MRMS), tandem time-of-flight instrument, to demonstrate the power and unique advantages of HRMSI and reveal how this new tool would benefit molecular imaging applications in neuroscience.


Figures

Figure 1
Figure 1
Comparison between HRMS- and MRMS-produced spectra acquired from serial rat CNS sections. (a) HRMS-generated spectrum corresponding to the region of interest (ROI) localized in the cortex region of a rat brain section as highlighted in (b). The inset shows an enlarged m/z range of 362–366 obtained on a MALDI LTQ Orbitrap XL. (c) MRMS-generated mass spectrum corresponding to an identical ROI from the cortex region of a serial rat brain section as shown in (d). The inset shows an enlarged m/z range of 362–366 obtained on a MALDI-TOF/TOF.
Figure 2
Figure 2
MS images of metabolites and NTs identified from rat CNS. (a) Optical image of a rat brain section subjected to MSI sample preparation. (b–g) MS image of metabolites and NTs, including (b) choline at m/z 104.1070, (c) ACh at m/z 146.1175, (d) AMP at m/z 348.0706, (e) GMP at m/z 364.0655, (f) cholesterol with neutral loss at m/z 369.3519, (g) potassiated PC(32:0) at m/z 772.5258, and (h) nicotinamide adenine dinucleotide at m/z 664.1177. Other than low MW molecules, (i) MS image of the acetylated peptide ASQKRPSQRHGSKYLATA at m/z 2028.076 was also shown. (j) Overlaid image of a NT, ACh, as in (c) and cholesterol-derived ion as in (f).
Figure 3
Figure 3
HRMSI spectra averaged from a blue crab brain section acquired on a MALDI LTQ Orbitrap XL. (a) Averaged HRMS spectra displaying the m/z range of 90–500. (b–d) Zoomed-in spectra shown in (a) over the range of (b) m/z 147.06–147.12, (c) m/z 175.98–176.04, and (d) m/z 385.94–386.14. Panels (e) and (f) display different distributions of two ions present in (c) from blue crab brain.
Figure 4
Figure 4
MS images of metabolites identified from crustacean CNS. (a) MS images of amino acids, including (from left to right) glutamine, lysine, histidine, carnitine, arginine, and hydroxyarginine. (b) MS images of nucleobase-derived metabolites, including (from left to right) adenine, guanine, AMP, GMP, potassiated AMP, and sodiated GMP. (c) MS images of organic acids, including the protonated and sodiated aminobenzoic acid and the sodiated aminopentanoic acid. (d) Overlaid image of the sodiated aminopentoic acid in red, the hydroxyarginine in green, and GMP in blue. Other than small molecules, (e) MS image of the neuropeptide GYRKPPFNGSIFa displayed a distinct distribution from all the metabolites shown above. (f) Overlaid image of AMP coded in red and the neuropeptide SIFamide shown in green.

Similar articles

Cited by

References

    1. Orešič M.; Hyötyläinen T.; Herukka S. K.; Sysi-Aho M.; Mattila I.; Seppänan-Laakso T.; Julkunen V.; Gopalacharyulu P. V.; Hallikainen M.; Koikkalainen J.; Kivipelto M.; Helisalmi S.; Lötjönen J.; Soininen H. (2011) Metabolome in progression to Alzheimer’s disease. Transl. Psychiatry 1, e57. - PMC - PubMed
    1. Houtkooper R. H.; Argmann C.; Houten S. M.; Canto C.; Jeninga E. H.; Andreux P. A.; Thomas C.; Doenlen R.; Schoonjans K.; Auwerx J. (2011) The metabolic footprint of aging in mice. Sci. Rep. 1, 134. - PMC - PubMed
    1. Krasensky J.; Jonak C. (2012) Drought, salt, and temperature stress-induced metabolic rearrangements and regulatory networks. J. Exp. Bot. 63, 1593–1608. - PMC - PubMed
    1. Want E. J.; Cravatt B. F.; Siuzdak G. (2005) The expanding role of mass spectrometry in metabolite profiling and characterization. ChemBioChem 6, 1941–51. - PubMed
    1. Marc D. T.; Ailts J. W.; Campeau D. C. A.; Bull M. J.; Olson K. L. (2011) Neurotransmitters excreted in the urine as biomarkers of nervous system activity: validity and clinical applicability. Neurosci. Biobehav. Rev. 35, 635–644. - PubMed

Publication types

MeSH terms