. 2013 Dec:24:109-16.
doi: 10.1016/j.anaerobe.2013.04.003. Epub 2013 Apr 20.

The relationship between phenotype, ribotype, and clinical disease in human Clostridium difficile isolates

Affiliations

The relationship between phenotype, ribotype, and clinical disease in human Clostridium difficile isolates

Paul E Carlson Jr et al. Anaerobe. 2013 Dec.

Abstract

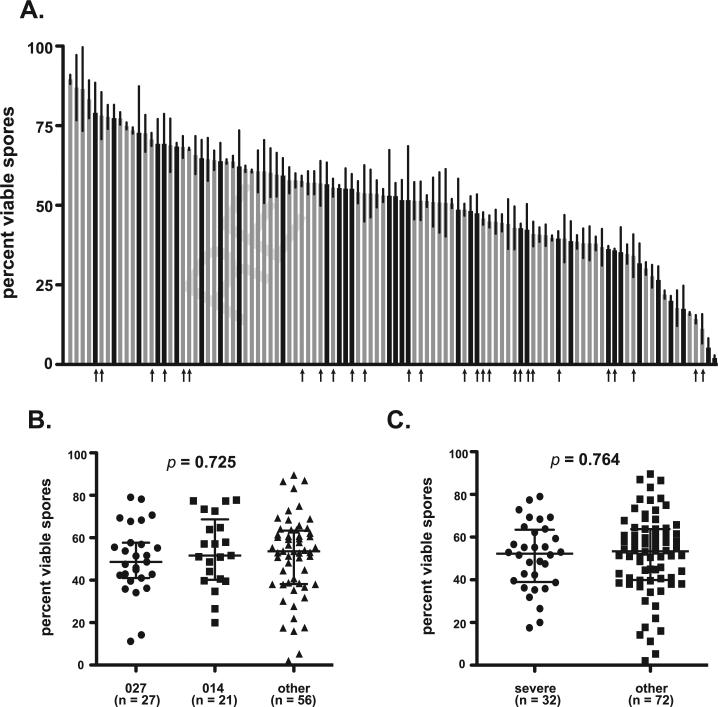
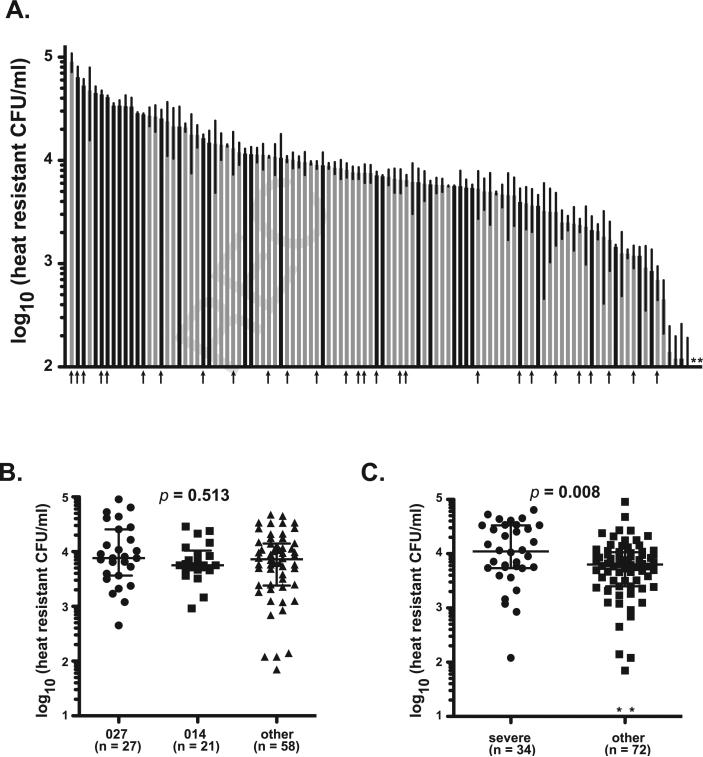
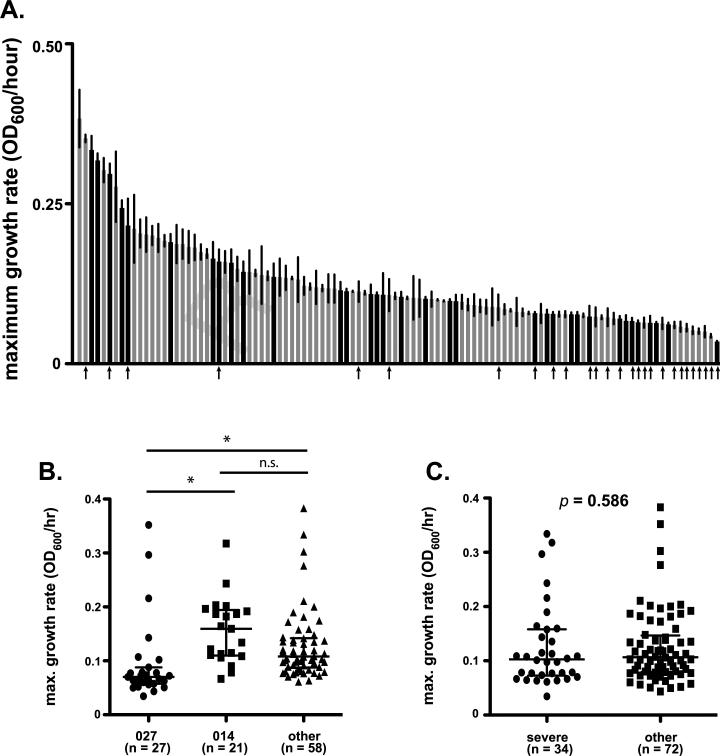
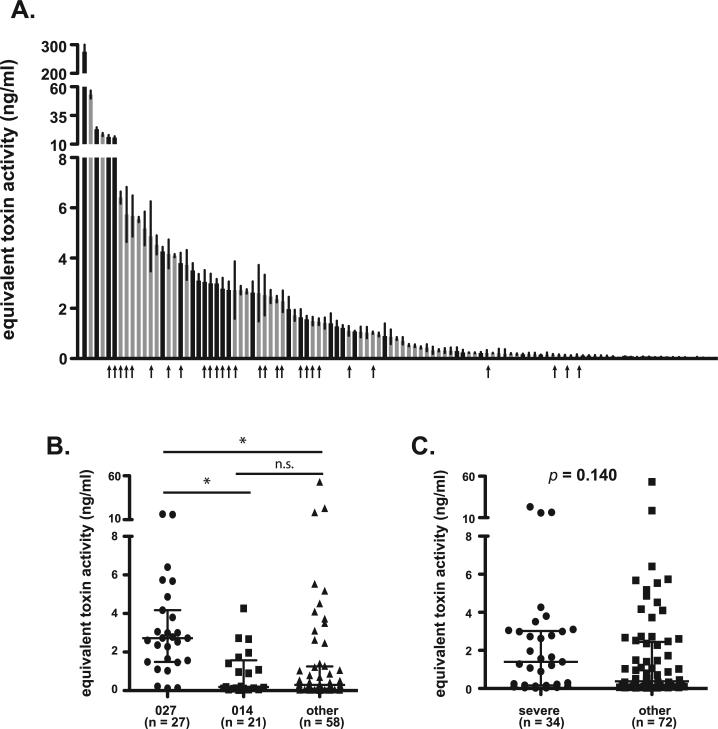
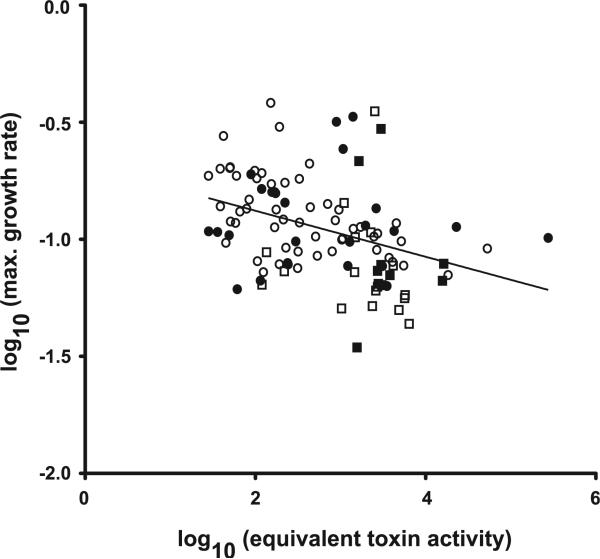
Since 2000, Clostridium difficile isolates of ribotype 027 have been linked to outbreaks in North America and Europe and also an increased rate of colectomy and death among infected individuals. It has been proposed that enhanced sporulation and toxin production were associated with this apparent increase in virulence of 027 isolates. Since only a limited number of isolates have been examined, the relationship of these phenotypes to a specific ribotype, and as well as to clinical disease severity, remains controversial. 106 recent clinical isolates from the University of Michigan Health System were characterized for the ability to sporulate, produce viable spores, grow in rich media, and produce toxins in vitro. Significant variation was observed between isolates for each of these phenotypes. Isolates of ribotype 027 produced higher levels of toxin and exhibited slower growth compared to other ribotypes. Importantly, increased spore production did appear to be relevant to severe C. difficile infection, as determined by available clinical meta-data. These data provide the first significant difference between isolates from severe vs. less severe disease based on an in vitro C. difficile phenotype and suggest that clinical outcome is better predicted by bacterial attributes other than ribotype.

Keywords: Clostridium difficile; NAP1/027; Ribotype; Sporulation.


Figures

Fig. 1
Fig. 1
Viability of spores produced by C. difficile clinical isolates. (A) Viability of spores for each clinical isolate was determined using colony forming efficiency assay. All measurements were performed in triplicate for each isolate and presented as the percent viable spores = ((CFU/ml)/(spore particles/ml)) × 100. Data are presented as % viable spores and represent mean ± SD of triplicate measurements. Black bars represent isolates that caused severe disease, while gray bars represent those that did not. Arrows indicate strains of ribotype 027. A similar figure labeled with labeled with all strain designations is available as supplementary data (Supplementary Figure 1A). (B) Comparison of median values with interquartile range for isolates representing ribotypes 027, 014, or “other.” Groups were compared for statistical significance using KruskaleWallis test (p = 0.725) followed by Dunn's test for column comparisons (no significant differences). (C) Comparison of median values with interquartile range for isolates that caused severe disease were compared to other using unpaired ManneWhitney t-test (p = 0.764).
Fig. 2
Fig. 2
Sporulation characteristic of C. difficile clinical isolates. (A) Total spore production following 24 h of in vitro growth was determined for each clinical isolate by measuring heat-resistant CFU. Data are presented as heat resistant CFU/ml (limit of detection ~100 spores/ml) and represent mean ± SD of three independent cultures. * = No spores were detected in any replicates for these isolates. Black bars represent isolates that caused severe disease, while gray bars represent those that did not. Arrows indicate strains of ribotype 027. A similar figure labeled with all strain designations is available as supplementary data (Supplementary Figure 1B). (B) Comparison of median values with interquartile range for isolates representing ribotypes 027, 014, or “other.” Groups were compared for statistical significance using Kruskal–Wallis test (p = 0.513) followed by Dunn's test for column comparisons (no significant differences). (C) Comparison of median values with interquartile range for isolates that caused severe disease were compared to other using unpaired Mann–Whitney t-test (p = 0.008).
Fig. 3
Fig. 3
Growth rate differences among C. difficile clinical isolates. (A) Maximal growth rates in BHIS broth were determined for each clinical isolate. Data are presented at maximum increase in OD600 per hour and represent mean ± SD of five independent curves for each isolate. Black bars represent isolates that caused severe disease, while gray bars represent those that did not. Arrows indicate strains of ribotype 027. A similar figure labeled with labeled with all strain designations is available as supplementary data (Supplementary Figure 1C). (B) Comparison of median values with interquartile range for isolates representing ribotypes 027, 014, or “other.” Groups were compared for statistical significance using Kruskal–Wallis test (p < 0.0001) followed by Dunn's test for column comparisons (* = p < 0.05). (C) Comparison of median values with interquartile range for isolates that caused severe disease were compared to other using unpaired Mann–Whitney t-test (p = 0.586).
Fig. 4
Fig. 4
Differences in toxin production by C. difficile clinical isolates. (A) Toxin production in vitro was measured for each clinical isolate using Vero cell cytotoxicity as measured by MTT assay. Toxin concentrations were estimated using a standard curve generated by treating Vero cells with purified C. difficile toxin B. Data are presented at equivalent toxin activity in ng/ml and represent mean ± SD of three independent cultures. Black bars represent isolates that caused severe disease, while gray bars represent those that did not. Arrows indicate strains of ribotype 027. A similar figure labeled with all strain designations is available as supplementary data (Supplementary Figure 1D). (B) Comparison of median values with interquartile range for isolates representing ribotypes 027, 014, or “other.” Groups were compared for statistical significance using Kruskal–Wallis test (p < 0.0001) followed by Dunn's test for column comparisons (* = p < 0.05). (C) Comparison of median values with interquartile range for isolates that caused severe disease were compared to other using unpaired ManneWhitney t-test (p = 0.140).
Fig. 5
Fig. 5
Negative correlation between isolate toxin production and growth rate. Scatterplot of log transformed growth rates vs. log transformed toxin levels. Closed squares = 027 – severe disease; open squares = 027 – non-severe disease; closed circles = other ribotypes e severe disease; open circles = other ribotypes – non-severe disease. Spearman correlation r = 0.4591; p > 0.0001.

References

    1. Kuijper EJ, Coignard B, Tull P. Emergence of Clostridium difficile-associated disease in North America and Europe. Clinical Microbiology and Infection. 2006;12(Suppl. 6):2–18. - PubMed
    1. Dubberke E. Clostridium difficile infection: the scope of the problem. Journal of Hospital Medicine. 2012;7(Suppl. 3):S1–4. - PubMed
    1. O'Connor JR, Johnson S, Gerding DN. Clostridium difficile infection caused by the epidemic BI/NAP1/027 strain. Gastroenterology. 2009;136:1913–24. - PubMed
    1. Akerlund T, Persson I, Unemo M, Noren T, Svenungsson B, Wullt M, et al. Increased sporulation rate of epidemic Clostridium difficile Type 027/NAP1. Journal of Clinical Microbiology. 2008;46:1530–3. - PMC - PubMed
    1. Merrigan M, Venugopal A, Mallozzi M, Roxas B, Viswanathan VK, Johnson S, et al. Human hypervirulent Clostridium difficile strains exhibit increased sporulation as well as robust toxin production. Journal of Bacteriology. 2010;192:4904–11. - PMC - PubMed

Publication types

MeSH terms

Substances

LinkOut - more resources