. 2013 Jul;33(13):2535-50.
doi: 10.1128/MCB.01435-12. Epub 2013 Apr 22.

Delineation of the key aspects in the regulation of epithelial monolayer formation

Affiliations

Delineation of the key aspects in the regulation of epithelial monolayer formation

Lydia Aschauer et al. Mol Cell Biol. 2013 Jul.

Abstract

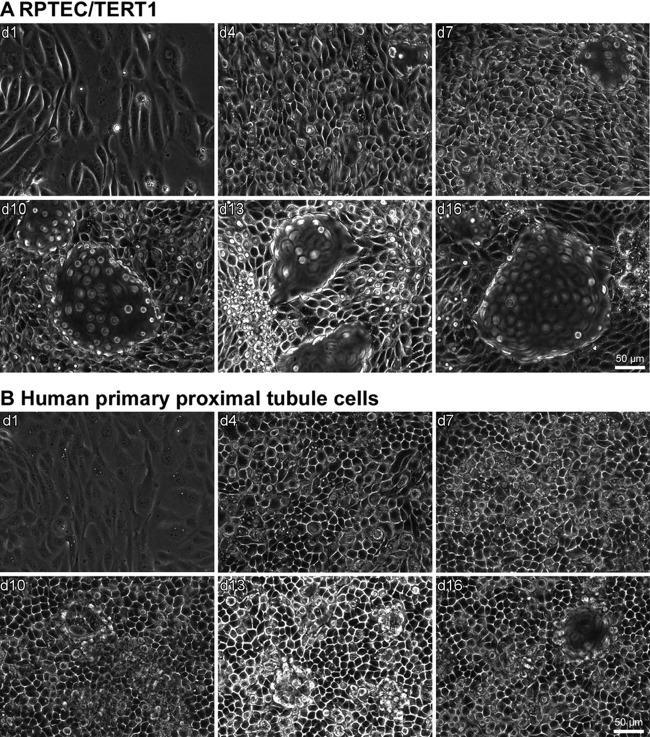
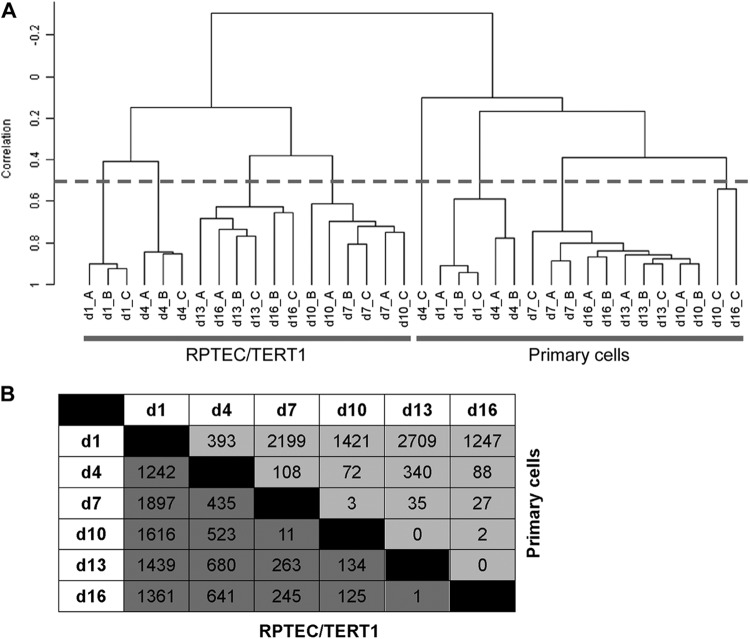
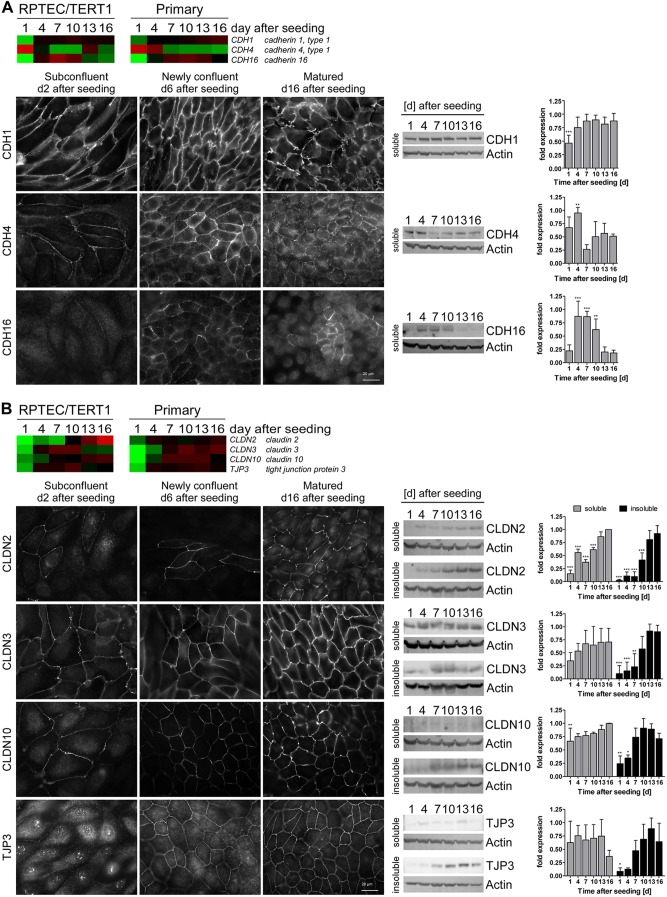
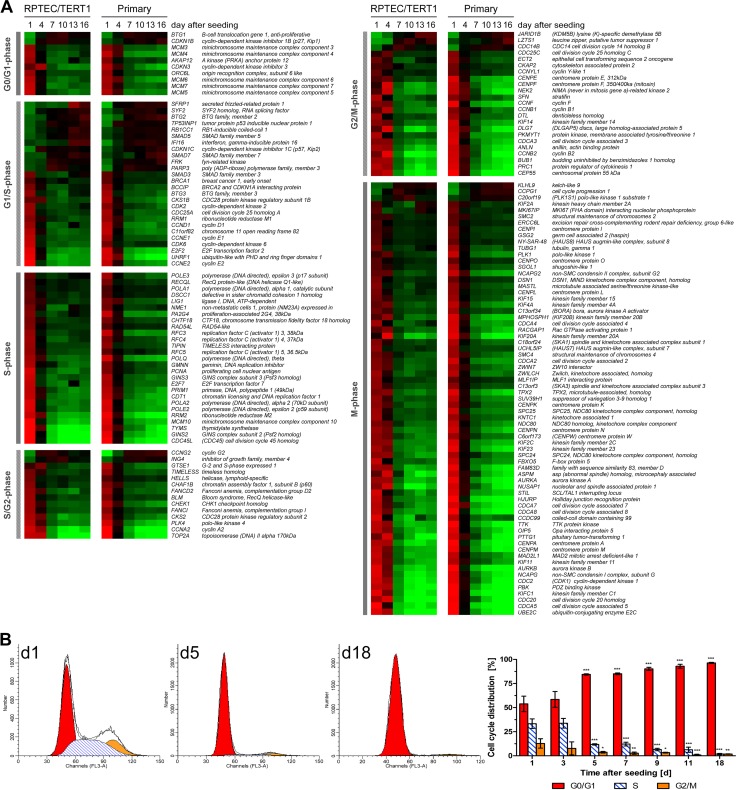
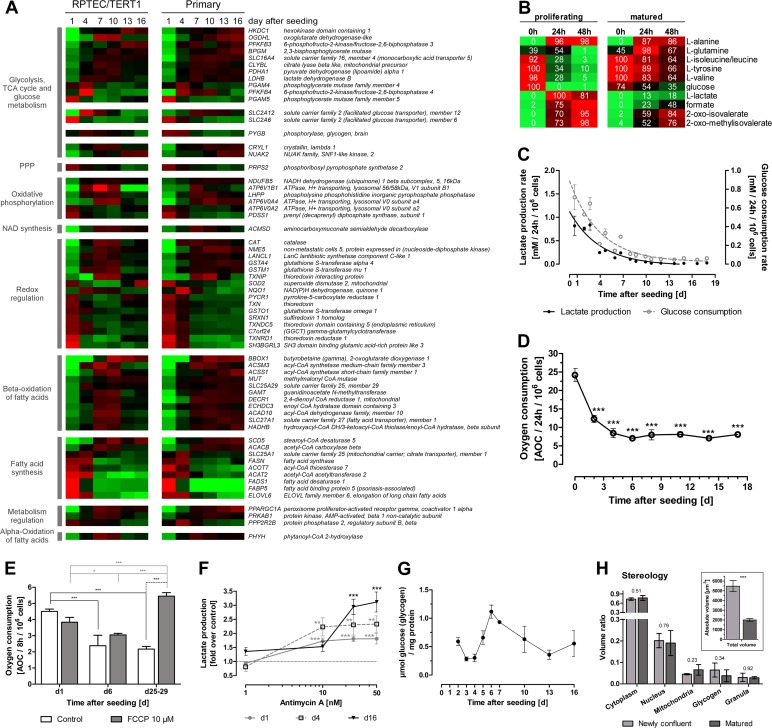
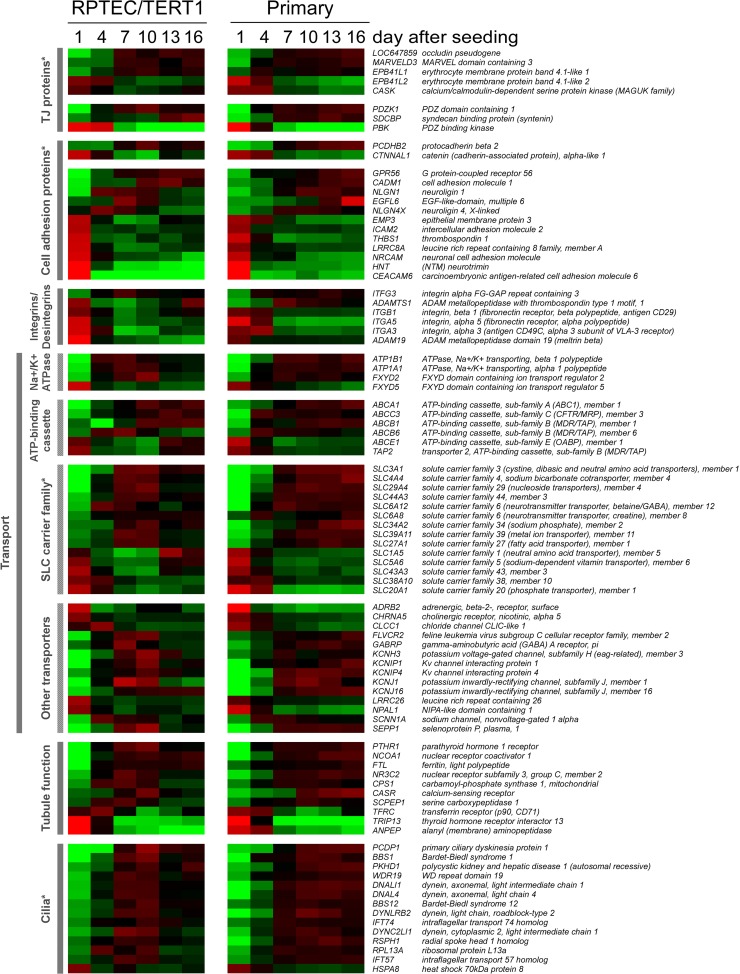
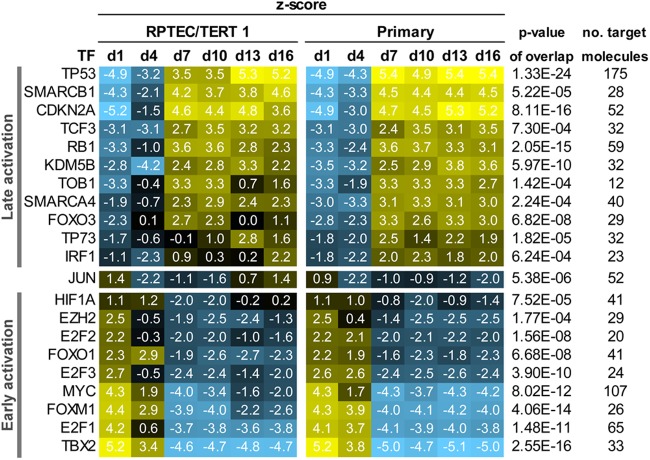
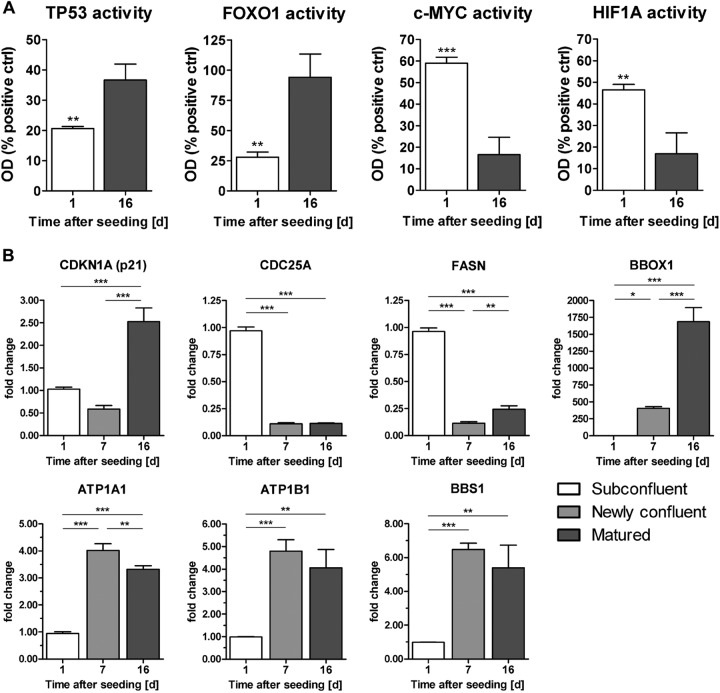
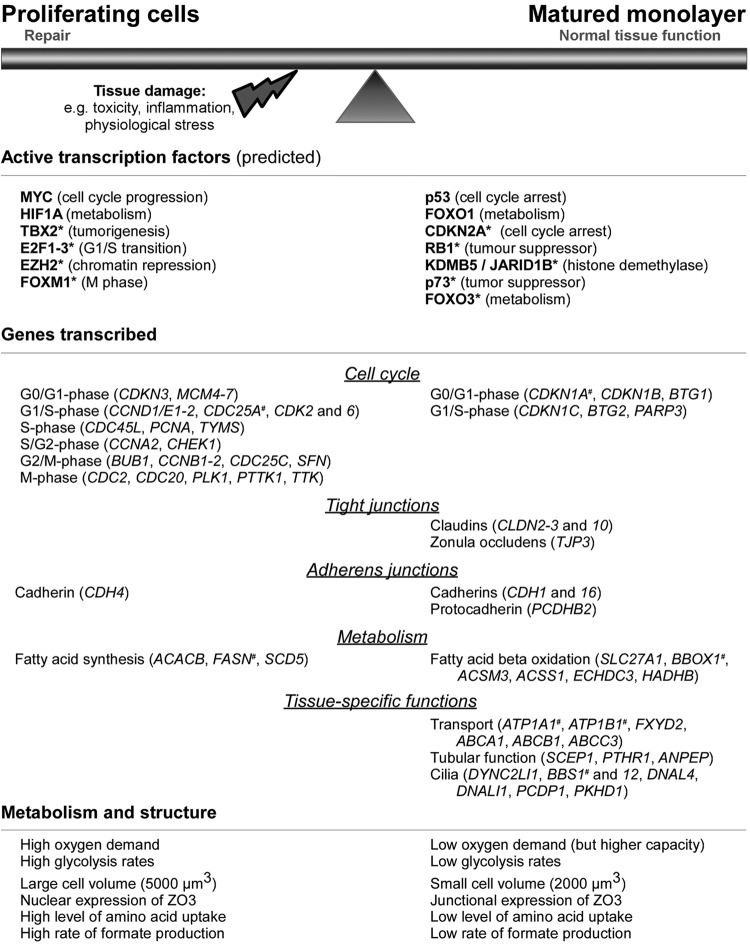
The formation, maintenance, and repair of epithelial barriers are of critical importance for whole-body homeostasis. However, the molecular events involved in epithelial tissue maturation are not fully established. To this end, we investigated the molecular processes involved in renal epithelial proximal-tubule monolayer maturation utilizing transcriptomic, metabolomic, and functional parameters. We uncovered profound dynamic alterations in transcriptional regulation, energy metabolism, and nutrient utilization over the maturation process. Proliferating cells exhibited high glycolytic rates and high transcript levels for fatty acid synthesis genes (FASN), whereas matured cells had low glycolytic rates, increased oxidative capacity, and preferentially expressed genes for beta oxidation. There were dynamic alterations in the expression and localization of several adherens (CDH1, -4, and -16) and tight junction (TJP3 and CLDN2 and -10) proteins. Genes involved in differentiated proximal-tubule function, cilium biogenesis (BBS1), and transport (ATP1A1 and ATP1B1) exhibited increased expression during epithelial maturation. Using TransAM transcription factor activity assays, we could demonstrate that p53 and FOXO1 were highly active in matured cells, whereas HIF1A and c-MYC were highly active in proliferating cells. The data presented here will be invaluable in the further delineation of the complex dynamic cellular processes involved in epithelial cell regulation.


Figures

Fig 1
Fig 1
Morphology of RPTEC/TERT1 (A) and primary cells (B) over the experimental time course. Phase-contrast images were captured at the indicated time points after seeding. Domes are visible as structures that are out of focus. Micrographs were obtained with a Zeiss Axiovert 100 microscope at a magnification of ×320.
Fig 2
Fig 2
Overview of gene alterations over monolayer formation. (A) Hierarchical clustering. Dendrogram of the hierarchical clustering (centered correlation and average linkage) of the unsupervised samples. The dashed line indicates a correlation of 0.5. Samples that had a correlation of <0.5 with their biological replicates were excluded from further analysis (n = 3). (B) Matrix showing the number of delta differentially expressed probes (DEP) (1.5-fold change; P < 0.001) between two time points for each cell model. Dark and light gray boxes indicate the numbers of DEPs for RPTEC/TERT1 and primary cells, respectively.
Fig 3
Fig 3
Adherens (A) and tight (B) junction protein expression during monolayer formation and maturation. (Top) Heat maps of adherens junction (AJ) and tight junction (TJ) protein genes. Average mean-centered mRNA expression values (log2) per time point and cell type were used to generate the heat maps. Cell colors reflect the value and direction of the expression value relative to the mean expression over all time points (red indicates higher expression and green indicates lower expression compared to the mean) (n = 3). (Bottom) Immunofluorescence staining and Western blots including band intensity quantification (RIPA buffer-soluble and -insoluble fractions; minimum n = 4) of AJ and TJ proteins in RPTEC/TERT1 cells at different time points after seeding. Band intensities were normalized first to actin and then to the maximum intensity per replicate. Values are means plus SD; statistical significances of changes in Western blot band intensities at day 16 were analyzed using one-way analysis of variance (ANOVA) with the Bonferroni multiple comparison test post hoc. *, P < 0.05; **, P < 0.01; ***, P < 0.001.
Fig 4
Fig 4
Cell cycle alterations over monolayer formation and maturation. (A) Heat map of cell cycle genes identified in the DEG list. Genes were assigned to G0/G1, G1/S, S, S/G2, G2/M, or M phase of the cell cycle and then ranked within a cell cycle phase according to the difference between day 1 and 16 values in the RPTEC/TERT1 data set. Average mean-centered mRNA expression values (log2) per time point and cell type were used to generate the heat map. Cell colors reflect the expression value and direction relative to the mean expression over all time points (red indicates higher expression and green indicates lower expression compared to the mean) (n = 3). (B) Cell cycle distribution of RPTEC/TERT1 cells at different time points after seeding. Values are means ± SD; statistical significance of changes compared to day 1 was analyzed using two-way ANOVA with the Bonferroni multiple comparison test post hoc. *, P < 0.05; **, P < 0.01; ***, P < 0.001 (n = 3 to 6).
Fig 5
Fig 5
Alterations in energy metabolism and mitochondrial function over monolayer formation and maturation. (A) Heat map of energy metabolism-associated genes. Genes are grouped according to their function in different metabolic pathways and then ranked within the group to the difference between day 1 and 16 values in the RPTEC/TERT1 data set. Average mean-centered mRNA expression values (log2) per time point and cell type are represented in red (higher expression compared to the mean) and green (lower expression compared to the mean) (n = 3). (B) Metabolic alterations measured by NMR in RPTEC/TERT1 supernatant. Values are minima and maxima, in percent, normalized per metabolite. Colors represent abundances of the respective metabolites, where red indicates high abundance and green indicates low abundance (n = 3). (C) Lactate production and glucose consumption rates over RPTEC/TERT1 maturation time. n = 3. (D) Oxygen consumption rate over RPTEC/TERT1 maturation time. Statistical significance was analyzed using one-way ANOVA with the Bonferroni multiple comparison test post hoc (n = 3). (E) Oxygen consumption of RPTEC/TERT1 cells after treatment with oxidative uncoupler FCCP for 8 h. Two-way ANOVA with the Bonferroni multiple comparison test post hoc was used to analyze statistical significance (n = 3). (F) Lactate production of RPTEC/TERT1 cells after treatment with the electron transfer chain complex III inhibitor antimycin A for 8 h. Statistical significance was analyzed using one-way ANOVA with the Bonferroni multiple comparison test post hoc to time-matched control (n = 3). (G) Glycogen storage at different time points after seeding (n = 3). (H) Relative volume of RPTEC/TERT1 cell fractions, as determined by stereology. Insert depicts the calculated absolute volume of newly confluent and matured cells. Statistical significance was analyzed by applying a two-tailed unpaired t test. P values are indicated above the bars (n = 3). (B to H) Experiments were performed with RPTEC/TERT1 cells. (C to H) Values are means ± SD. *, P < 0.05; **, P < 0.01; ***, P < 0.001. PPP, pentose phosphate pathway.
Fig 6
Fig 6
Functional grouping of genes exhibiting time-dependent expression during epithelial monolayer maturation. Genes were ranked within the allocated group according to the difference between day 1 and 16 values in the RPTEC/TERT1 data set. Cell colors reflect the value and direction of the expression value relative to the mean over all time points (red indicates higher expression and green indicates lower expression compared to the mean) (n = 3). An asterisk indicates that the group contains members that are shown in previous heat maps.
Fig 7
Fig 7
Predicted transcription factors (TFs) involved in the maturation process. Colors reflect the regulation z score and direction of regulation: yellow indicates activation and blue indicates inhibition of the given TF. All TFs in this table had a P value of <0.001 for the overlap and a z score of >2 or <−2 at at least one time point in both cell models.
Fig 8
Fig 8
(A) Activation levels of TFs TP53, FOXO1, c-MYC, and HIF1A in RPTEC/TERT1 nuclear extracts at days 1 and 16 after seeding. Values are means plus SD (n = 3). Statistical significance was analyzed by applying a two-tailed unpaired t test. *, P < 0.05; **, P < 0.01; ***, P < 0.001. (B) qPCR of selected genes in RPTEC/TERT1 cells at subconfluent (day 1 after seeding), newly confluent (day 7 after seeding), and matured (day 16 after seeding) time points. Values are changes in copy number (fold) relative to biological replicate 1 on day 1. Values are means and SD (n = 3). Statistical significance was analyzed using one-way ANOVA with the Bonferroni multiple comparison test post hoc. *, P < 0.05; **, P < 0.01; ***, P < 0.001.
Fig 9
Fig 9
Summary of key mechanisms and players in epithelial monolayer maturation. *, predicted transcription factor; #, expression confirmed using qPCR.

References

    1. Jennings P, Koppelstaetter C, Lechner J, Pfaller W. 2008. Renal culture models: contribution to the understanding of nephrotoxic mechanisms, p. 223–250 In Broe ME, Porter GA. (ed), Clinical nephrotoxins: renal injury from drugs and chemicals, 3rd ed Springer, New York, NY
    1. Muto S, Hata M, Taniguchi J, Tsuruoka S, Moriwaki K, Saitou M, Furuse K, Sasaki H, Fujimura A, Imai M, Kusano E, Tsukita S, Furuse M. 2010. Claudin-2-deficient mice are defective in the leaky and cation-selective paracellular permeability properties of renal proximal tubules. Proc. Natl. Acad. Sci. U. S. A. 107: 8011–8016 - PMC - PubMed
    1. Gstraunthaler G, Pfaller W, Kotanko P. 1985. Interrelation between oxygen consumption and Na-K-ATPase activity in rat renal proximal tubule suspension. Ren. Physiol. 8: 38–44 - PubMed
    1. Pfaller W, Gstraunthaler G. 1998. Nephrotoxicity testing in vitro–what we know and what we need to know. Environ. Health Perspect 106(Suppl. 2): 559–569 - PMC - PubMed
    1. Jennings P. 2009. Epithelial cell cultures as tools to study human disease and the adverse effects of pharmaceuticals and chemicals. Habilitation thesis Medizinische Universität Innsbruck, Innsbruck, Austria

Publication types

MeSH terms

LinkOut - more resources