

Feasibility of image-based simulation to estimate ablation target in human ventricular arrhythmia
- PMID: 23608593
- PMCID: PMC3735782
- DOI: 10.1016/j.hrthm.2013.04.015
Feasibility of image-based simulation to estimate ablation target in human ventricular arrhythmia
Abstract
Background: Previous studies suggest that magnetic resonance imaging with late gadolinium enhancement (LGE) may identify slowly conducting tissues in scar-related ventricular tachycardia (VT).
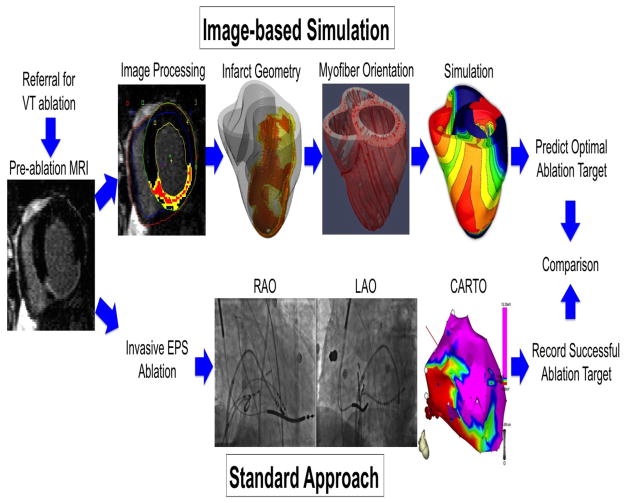
Objective: To test the feasibility of image-based simulation based on LGE to estimate ablation targets in VT.
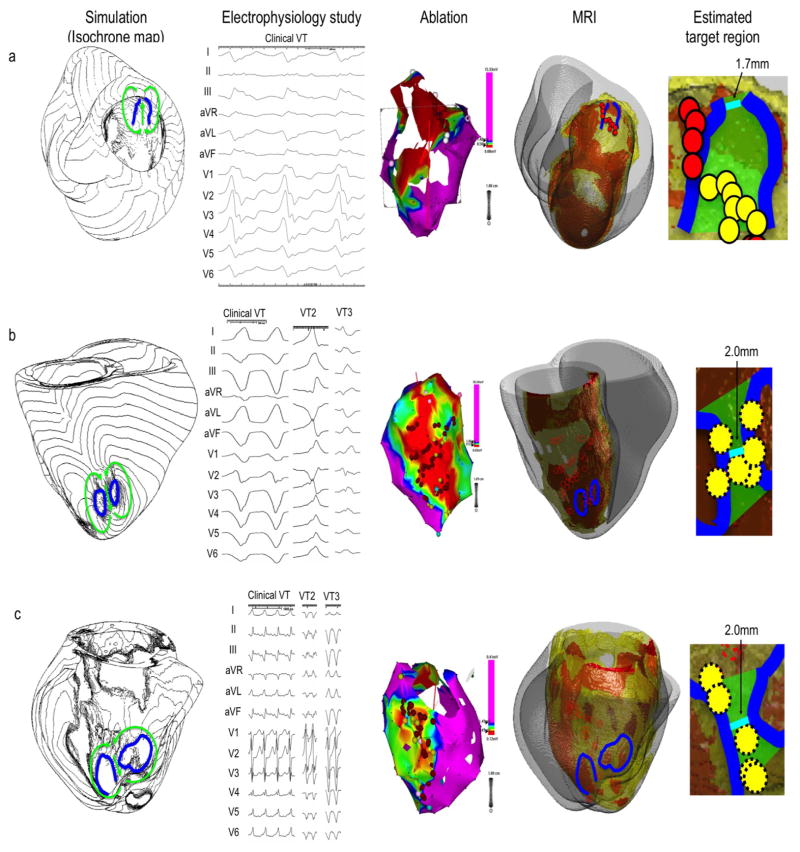
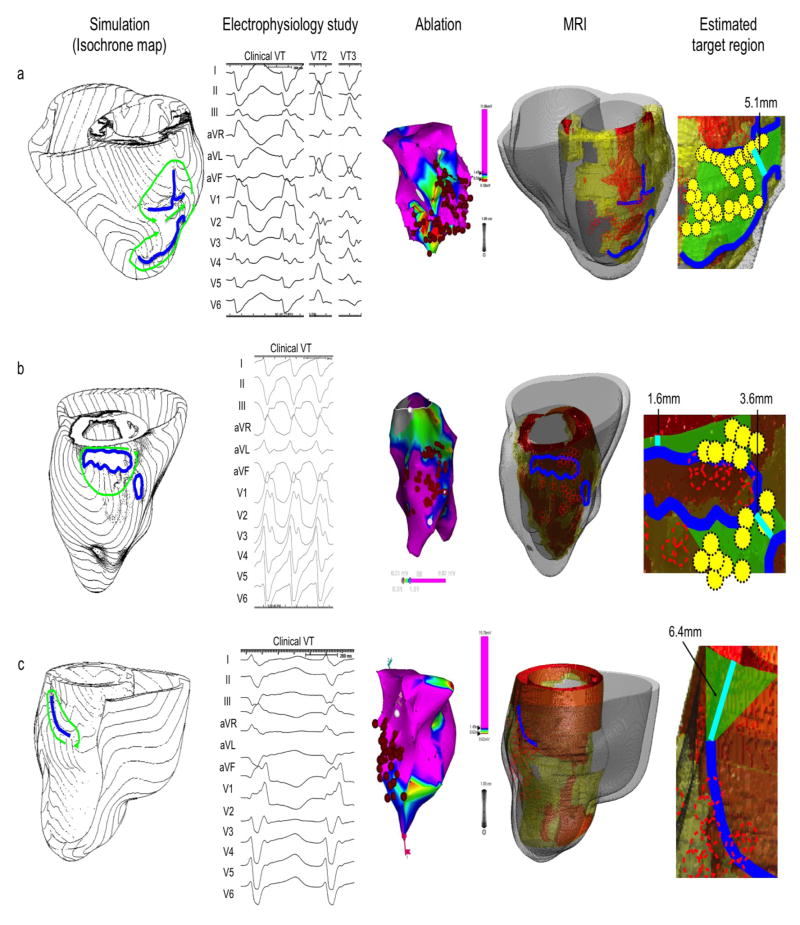
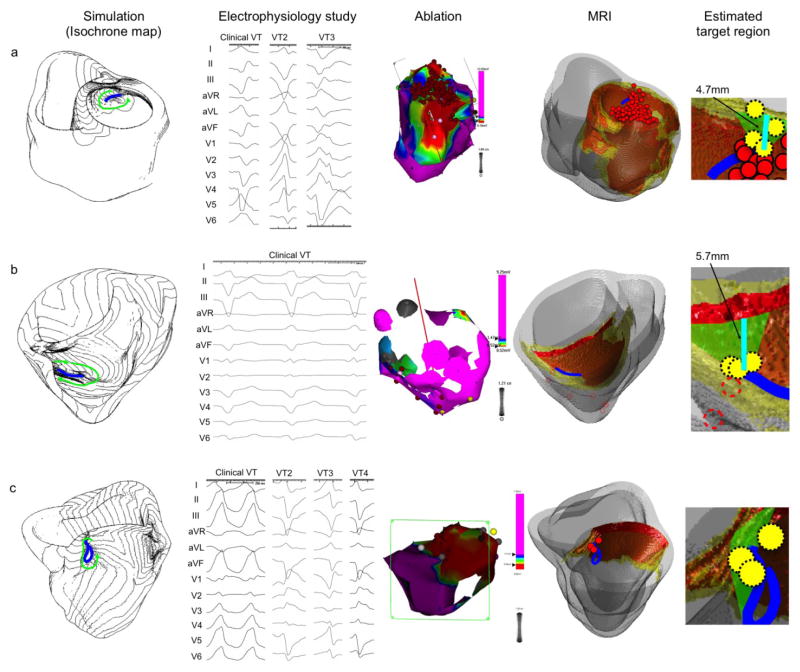
Methods: We conducted a retrospective study in 13 patients who had preablation magnetic resonance imaging for scar-related VT ablation. We used image-based simulation to induce VT and estimate target regions according to the simulated VT circuit. The estimated target regions were coregistered with the LGE scar map and the ablation sites from the electroanatomical map in the standard ablation approach.
Results: In image-based simulation, VT was inducible in 12 (92.3%) patients. All VTs showed macroreentrant propagation patterns, and the narrowest width of estimated target region that an ablation line should span to prevent VT recurrence was 5.0 ± 3.4 mm. Of 11 patients who underwent ablation, the results of image-based simulation and the standard approach were consistent in 9 (82%) patients, where ablation within the estimated target region was associated with acute success (n = 8) and ablation outside the estimated target region was associated with failure (n = 1). In 1 (9%) case, the results of image-based simulation and the standard approach were inconsistent, where ablation outside the estimated target region was associated with acute success.
Conclusions: The image-based simulation can be used to estimate potential ablation targets of scar-related VT. The image-based simulation may be a powerful noninvasive tool for preprocedural planning of ablation procedures to potentially reduce the procedure time and complication rates.
Keywords: 3-D; 3-dimensional; Cardiac MRI; Catheter ablation; Computer simulation; ECG; EPS; HZ; ICD; Image-based simulation; LGE; LV; MI; MRI; SI; VT; Ventricular arrhythmia; electrocardiogram/electrocardiographic; electrophysiology study; heterogeneous zone; implantable cardioverter-defibrillator; late gadolinium enhancement; left ventricular; magnetic resonance imaging; myocardial infarction; signal intensity; ventricular tachycardia.
Copyright © 2013 Heart Rhythm Society. Published by Elsevier Inc. All rights reserved.
Figures
Comment in
-
Ablation targets in reentrant ventricular tachycardia.Heart Rhythm. 2013 Aug;10(8):1117-8. doi: 10.1016/j.hrthm.2013.05.007. Epub 2013 May 9. Heart Rhythm. 2013. PMID: 23665385 No abstract available.
References
-
- de Bakker JM, van Capelle FJ, Janse MJ, et al. Reentry as a cause of ventricular tachycardia in patients with chronic ischemic heart disease: electrophysiologic and anatomic correlation. Circulation. 1988;77:589–606. - PubMed
-
- Stevenson WG, Khan H, Sager P, et al. Identification of reentry circuit sites during catheter mapping and radiofrequency ablation of ventricular tachycardia late after myocardial infarction. Circulation. 1993;88:1647–1670. - PubMed
-
- Stevenson WG, Wilber DJ, Natale A, et al. Irrigated radiofrequency catheter ablation guided by electroanatomic mapping for recurrent ventricular tachycardia after myocardial infarction: the multicenter thermocool ventricular tachycardia ablation trial. Circulation. 2008;118:2773–2782. - PubMed
-
- Tanner H, Hindricks G, Volkmer M, et al. Catheter ablation of recurrent scar-related ventricular tachycardia using electroanatomical mapping and irrigated ablation technology: results of the prospective multicenter Euro-VT-study. Journal of cardiovascular electrophysiology. 2010;21:47–53. - PubMed
-
- Calkins H, Epstein A, Packer D, et al. Catheter ablation of ventricular tachycardia in patients with structural heart disease using cooled radiofrequency energy: results of a prospective multicenter study. Cooled RF Multi Center Investigators Group. Journal of the American College of Cardiology. 2000;35:1905–1914. - PubMed
Publication types
MeSH terms
Substances
Grants and funding
LinkOut - more resources
Full Text Sources
Other Literature Sources
Medical
