

OrganellarGenomeDRAW--a suite of tools for generating physical maps of plastid and mitochondrial genomes and visualizing expression data sets
- PMID: 23609545
- PMCID: PMC3692101
- DOI: 10.1093/nar/gkt289
OrganellarGenomeDRAW--a suite of tools for generating physical maps of plastid and mitochondrial genomes and visualizing expression data sets
Abstract
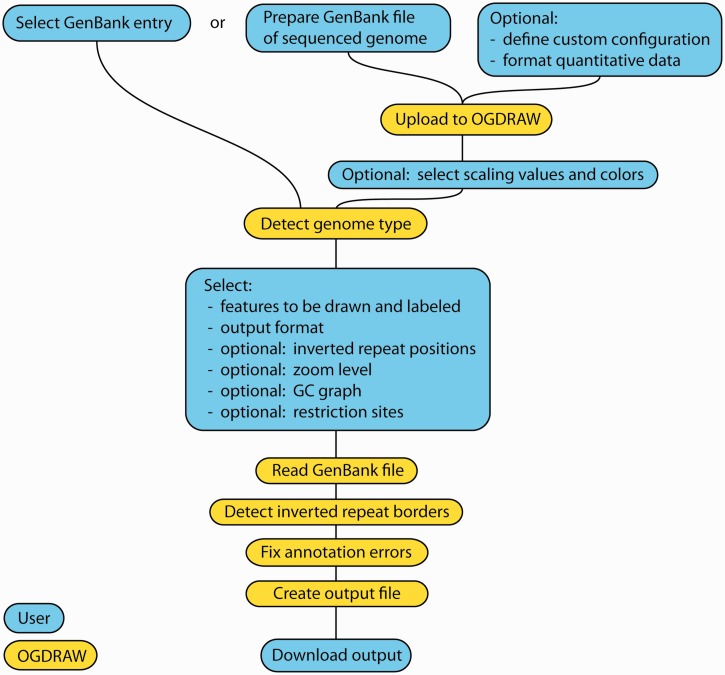
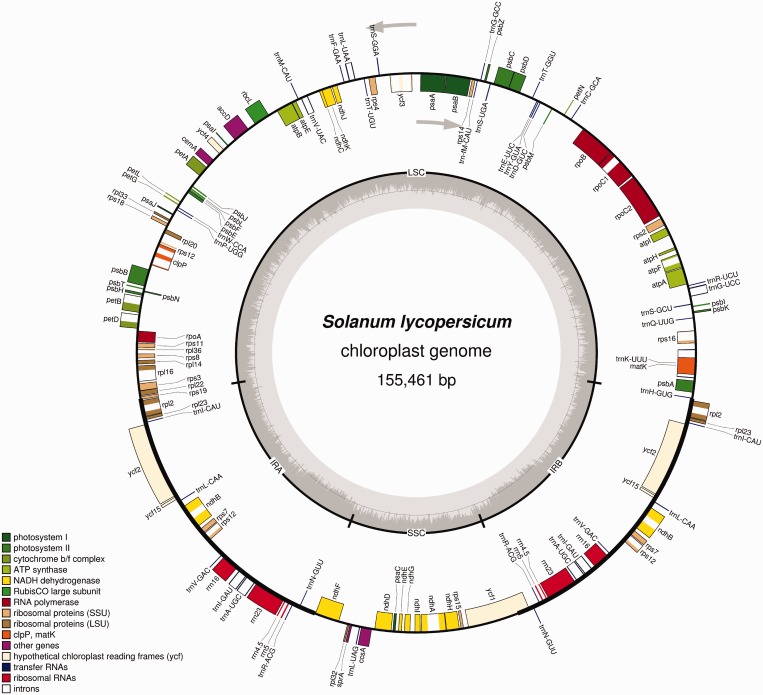
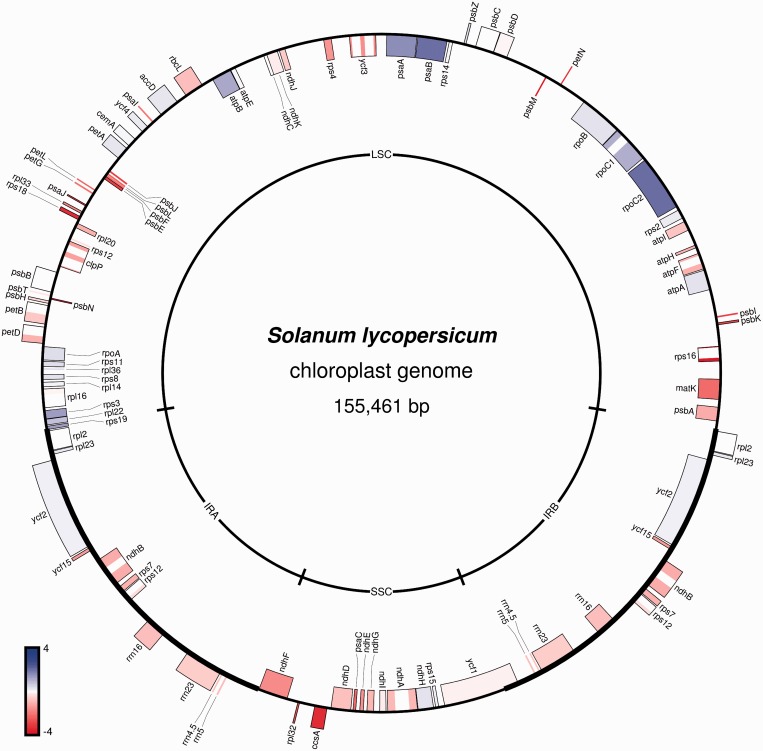
Mitochondria and plastids (chloroplasts) are cell organelles of endosymbiotic origin that possess their own genetic information. Most organellar DNAs map as circular double-stranded genomes. Across the eukaryotic kingdom, organellar genomes display great size variation, ranging from ∼15 to 20 kb (the size of the mitochondrial genome in most animals) to >10 Mb (the size of the mitochondrial genome in some lineages of flowering plants). We have developed OrganellarGenomeDraw (OGDRAW), a suite of software tools that enable users to create high-quality visual representations of both circular and linear annotated genome sequences provided as GenBank files or accession numbers. Although all types of DNA sequences are accepted as input, the software has been specifically optimized to properly depict features of organellar genomes. A recent extension facilitates the plotting of quantitative gene expression data, such as transcript or protein abundance data, directly onto the genome map. OGDRAW has already become widely used and is available as a free web tool (http://ogdraw.mpimp-golm.mpg.de/). The core processing components can be downloaded as a Perl module, thus also allowing for convenient integration into custom processing pipelines.
Figures
References
-
- Gray MW. Origin and evolution of organelle genomes. Curr. Opin. Genet. Dev. 1993;3:884–890. - PubMed
-
- Adams KL, Palmer JD. Evolution of mitochondrial gene content: gene loss and transfer to the nucleus. Mol. Phyl. Evol. 2003;29:380–395. - PubMed
-
- Bock R, Timmis JN. Reconstructing evolution: gene transfer from plastids to the nucleus. BioEssays. 2008;30:556–566. - PubMed
-
- Wakasugi T, Tsudzuki T, Sugiura M. The genomics of land plant chloroplasts: gene content and alteration of genomic information by RNA editing. Photosynthesis Res. 2001;70:107–118. - PubMed
MeSH terms
LinkOut - more resources
Full Text Sources
Other Literature Sources
Miscellaneous
