. 2013 May;5(5):707-22.
doi: 10.1002/emmm.201201504. Epub 2013 Apr 22.

Stathmin regulates mutant p53 stability and transcriptional activity in ovarian cancer

Affiliations

Stathmin regulates mutant p53 stability and transcriptional activity in ovarian cancer

Maura Sonego et al. EMBO Mol Med. 2013 May.

Erratum in

  • EMBO Mol Med. 2014 Feb;6(2):295

Abstract

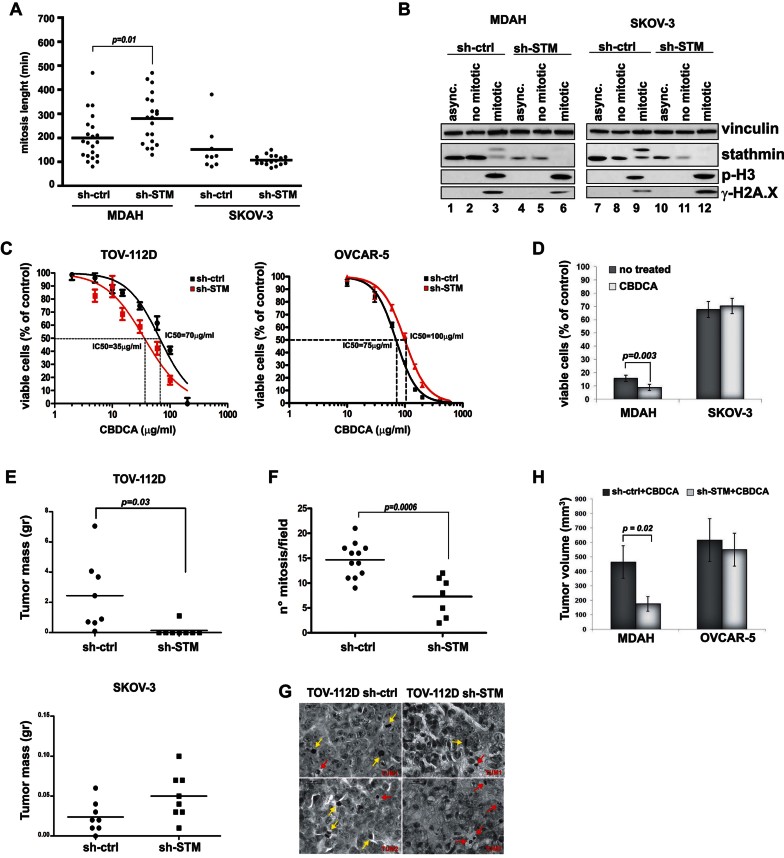
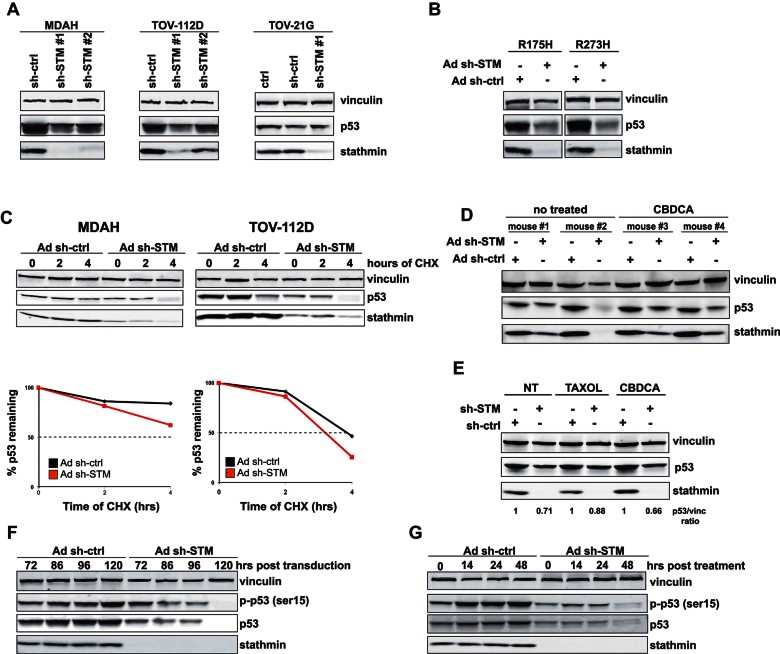
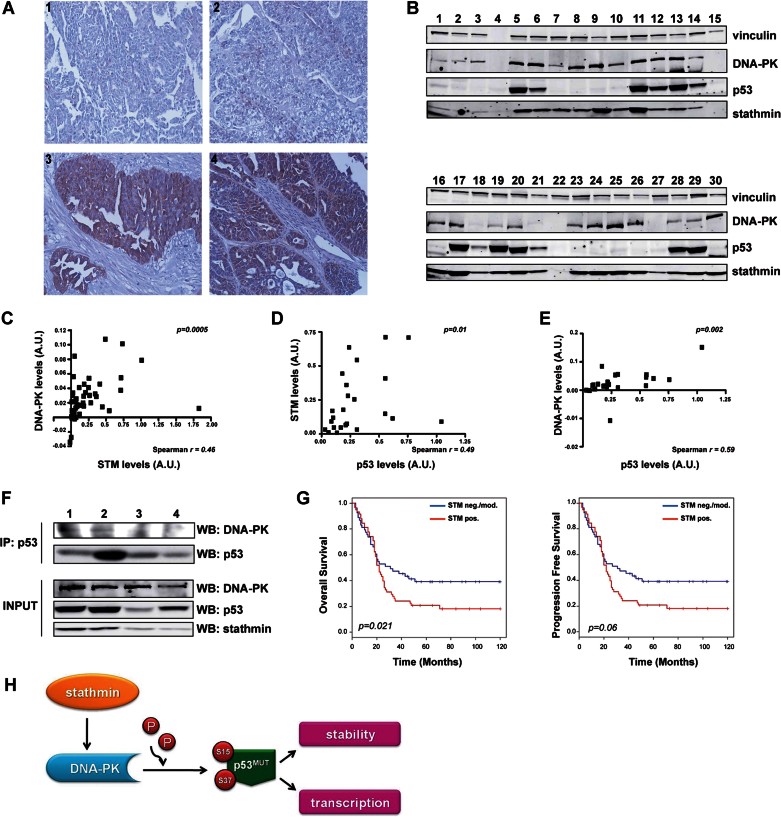
Stathmin is a p53-target gene, frequently overexpressed in late stages of human cancer progression. Type II High Grade Epithelial Ovarian Carcinomas (HG-EOC) represents the only clear exception to this observation. Here, we show that stathmin expression is necessary for the survival of HG-EOC cells carrying a p53 mutant (p53(MUT) ) gene. At molecular level, stathmin favours the binding and the phosphorylation of p53(MUT) by DNA-PKCS , eventually modulating p53(MUT) stability and transcriptional activity. Inhibition of stathmin or DNA-PKCS impaired p53(MUT) -dependent transcription of several M phase regulators, resulting in M phase failure and EOC cell death, both in vitro and in vivo. In primary human EOC a strong correlation exists between stathmin, DNA-PKCS , p53(MUT) overexpression and its transcriptional targets, further strengthening the relevance of the new pathway here described. Overall our data support the hypothesis that the expression of stathmin and p53 could be useful for the identification of high risk patients that will benefit from a therapy specifically acting on mitotic cancer cells.


Figures

Figure 1
Figure 1
Stathmin silencing affects viability of HG-EOC cells harboring mutations of p53. Source data is available for this figure in the Supporting Information. A. Stathmin and p53 protein expression in total protein extracts from nine EOC cell lines. B. Expression of stathmin in EOC cell lines transduced with control shRNA (sh-ctrl) or two different stathmin shRNAs (sh-STM #1 and sh-STM #2). Vinculin was used as loading control. C. MTS assay comparing cell viability of the indicated EOC cell lines 72 h after shRNAs transduction. Results are expressed as percentage of viable cells respect to sh-ctrl treated cells. D. Growth curves of EOC cells transduced with sh-ctrl or sh-STM #1. E. MTS assay comparing cell viability of SKOV-3 cells expressing p53R175H or p53R273H mutants transduced or not with stathmin shRNA. Results (C–E) represent the mean ± SD of three independent experiments performed in triplicate (growth curve) or quadruplicate (MTS assays). Statistically significant differences are reported. p values were calculated using t-test.
Figure 2
Figure 2
Stathmin expression is necessary for survival of p53MUT HG-EOC cells following DNA damage, in vitro and in vivo Source data is available for this figure in the Supporting Information. A. M phase length in MDAH and SKOV-3 cells transduced with STM- or ctrl-shRNAs and analysed by time lapse video microscopy. In the scattered dot plot (n = 20 mitosis, in each condition) the median value of mitosis lenght (black bar) is reported. B. Western blot analyses of EOC cells harvested by mitotic shake off probed for stathmin, p-Histone H3 (p-H3) and p-Histone H2.X (γH2A.X) expression. Stathmin phosphorylation (higher MW band) and p-H3 confirmed that shaken-off cells were in M phase (lanes 3, 6, 9, 12). C. Evaluation of IC50 in the indicated cell lines treated with increasing doses of CBDCA, in the presence or not of stathmin shRNA. Curves were fitted by nonlinear regression using GraphPad Prism. Results represent the mean (±SD) of three independent experiments performed in quadruplicate. D. Cell survival of stathmin silenced mitotic cells treated or not with CBDCA for 2 h. Results are expressed as percentage of viable cells respect to controls and represent mean ± SD of four independent experiments performed in quadruplicate. E. Subcutaneous growth of TOV-112D (upper panel) and SKOV-3 (lower panel) cells stably transduced with control (sh-ctrl) or stathmin (sh-STM) shRNAs. Results are expressed as scattered dot plot (n = 8) with median (black bar) tumour weight. F. Mitotic index of tumours formed by TOV-112D cells described in E. Data are expressed as number of mitoses/field (40× objective) in at least seven randomly selected fields. G. Representative H&E staining of tissue sections described in F and collected using a 100× objective (Bar = 20 µm). Yellow arrows indicate normal or aberrant mitosis, red arrows indicate condensed and fragmented nuclei resembling mitotic catastrophes figures. H. Growth of MDAH and OVCAR-5 xenografts in nude mice treated with intratumoural injection of control (sh-ctrl) or stathmin (sh-STM) sh-RNAs and with intraperitoneal treatment of CBDCA. Results represent the mean (±SD) volume of explanted tumours (n = 5). p values were calculated using t-test using or Mann–Whitney test. Statistically significant differences are reported in each panel.
Figure 3
Figure 3
Stathmin knockdown controls p53MUT stability. Source data is available for this figure in the Supporting Information. A. Western blot analysis of p53 and stathmin expression in MDAH, TOV-112D and TOV-21G cells, transduced or not with stathmin shRNAs. B. Western blot analysis of stathmin and p53 expression in SKOV-3 cells expressing p53R175H or p53R273H mutants, transduced or not with stathmin shRNA. C. Western blot analysis of p53 and stathmin expression in MDAH and TOV-112D cells transduced with Ad sh-ctrl or Ad sh-STM and treated with 10 µg/ml CHX for 2 or 4 h, as indicated. Densitometric analysis of p53 expression (normalized respect to vinculin expression) is reported in the bottom graphs. D. Western blot analysis of p53 and stathmin expression in MDAH xenograft tumours after transduction with control (Ad sh-ctrl) or stathmin shRNAs (Ad sh-STM) and treated or not with CBDCA. E. Western blot analysis of p53 and stathmin expression in MDAH cells transduced with sh-ctrl or sh-STM and treated with TAXOL or CBDCA, as indicated. Densitometric analysis of normalized p53 expression is reported. F,G. Time course analysis of p53 and pS15-p53 protein expression in MDAH cells after stathmin knockdown (F) and after CBDCA treatment (G). Vinculin was used as loading control in all Western blots.
Figure 4
Figure 4
Stathmin regulates survival of p53MUT HG-EOC cells by controlling DNA-PK expression. Source data is available for this figure in the Supporting Information. A,B. DNA-PK expression in EOC cells (A) and in MDAH xenograft tumours (B) after transduction with control (sh-ctrl) or stathmin shRNAs (sh-STM) in the presence or not of CBDCA treatment, as indicated. C. qRT-PCR analyses of DNA-PK expression in stathmin silenced cells. Data are expressed as percent of mRNA levels with respect to control (sh-ctrl) transduced cells and represent the mean (±SD) of three independent experiments performed in duplicate. D. Western blot analysis of DNA-PK expression in cells stably transduced with sh-ctrl or sh-DNA-PK, as indicated. E. MTS assay comparing cell viability of the EOC cell lines described in D. Data are expressed as percent of viable cells with respect to control transduced cells and represent the mean of three independent experiments performed in quadruplicate. F. Evaluation of IC50 in the indicated EOC cell lines for increasing doses of CBDCA. Data represent the mean of three independent experiments performed in quadruplicate. G. MTS assay comparing cell viability of TOV-112D and OVCAR-5 cell lines stable transduced with sh-DNA-PKcs or sh-ctrl in combination or not with stathmin silencing. In E and G results are expressed as percentage of viable cells with respect to sh-ctrl transduced cells and represent mean (±SD) of three independent experiments performed in quadruplicate. Significant p values are reported in the figure and were calculated using t-test.
Figure 5
Figure 5
DNA-PK binding to p53MUT is regulated by DNA damage and stathmin expression. Source data is available for this figure in the Supporting Information. A. Co-immunoprecipitation analyses in protein lysates derived from the indicated cell lines. Total cell lysates (input, lower panels) were immunoprecipitated with the indicated antibodies (or control IgG) and probed for DNA-PK, stathmin and p53 expression. B. Western blot analysis of DNA-PK and p53 expression in p53-immunoprecipitated lysates (input, lower panels) from MDAH-sh-STM, or sh-ctrl. IgG indicates a negative control in which lysate was immunoprecipitated using an unrelated antibody. C. Western blot analysis of DNA-PK and p53 expression in lysates (input, lower panels) derived from MDAH cells treated or not with CBDCA and immunoprecipitated with specific anti-DNA-PK antibody or control IgG, as indicated. D. Co-immunoprecipitation analyses of protein lysates derived from SKOV-3 cells transfected with the indicated p53 cDNAs, immunoprecipitated with anti-p53 specific antibodies (or controls IgG), as indicated, and probed for DNA-PK, and p53 expression. The expression levels of p53 and DNA-PK in total cell lysates are reported in the lower panels (input). E. Co-immunoprecipitation analyses of protein lysates derived from SKOV-3 cells transfected with p53WT cDNA and treated with CBDCA for 3 h. Lysates (input, lower panels) were immunoprecipitated and probed with the indicated antibodies (or control IgG). F. Western blot analysis of phosphorylated DNA-PK (pThr 2609) and p53 (S15 and S37) in MDAH and TOV-112D cells, treated for 14 h with NU7441 alone or in combination with CBDCA and analysed 6 h after treatment. Vinculin was used as loading control.
Figure 6
Figure 6
Stathmin regulates p53MUT stability modulating Ser15 and 37 phosphorylations. Source data is available for this figure in the Supporting Information. A. Western blot analysis of total p53, pS15-p53 and pS37-p53 in SKOV-3 transfected with the indicated mutants. B. Western blot analysis of p53 and stathmin expression in SKOV-3 cells transfected with the indicated p53 mutants and then transduced with ctrl- or STM-shRNAs. Vinculin was used as loading control. On the right, the densitometric analysis of the blots is reported, expressed as normalized p53 expression (p53/vinculin ratio). C,D. Western blot analyses of p53 and stathmin expression in SKOV-3 cells transfected with p53R175H and p53R175H-AA (C) or p53R273H and p53R273H-AA (D), transduced with ctrl- or STM-shRNAs and then treated with cycloheximide for 6 and 8 h. Vinculin was used as loading control. E. Co-immunoprecipitation analyses of protein lysates derived from SKOV-3 cells stable transfected with p53R175H and p53R175H-AA, transduced with ctrl- or STM-shRNAs, immunoprecipitated with anti-p53 specific antibody (or controls IgG), as indicated, and probed for Mdm2 and p53 expression. The expression levels of p53 and Mdm2 in total cell lysates are reported in the lower panels (input).
Figure 7
Figure 7
Stathmin modulates p53MUT transcriptional activity. Source data is available for this figure in the Supporting Information. A. qRT-PCR analyses of the indicated genes in EOC cell lines, transduced with Ad sh-STM or Ad sh-ctrl. Data are expressed as percentage of mRNA expression in sh-STM cells respect to sh-ctrl cells and represent the mean (±SD) of at least of three independent experiments. * p ≤ 0.05, ** p ≤ 0.001 and *** p ≤ 0.0001. B. Western blot analysis of DNA-PK, BUB1 and stathmin expression in MDAH and SKOV-3 cells, transduced with Ad sh-STM or Ad sh-ctrl. Numbers at the bottom of the panel report the densitometric analysis of normalized BUB1 expression and represent the mean of two experiments. C. BUB1 protein expression in SKOV-3 cells expressing p53R175H or p53R273H mutants. D. BUB1 protein expression in MDAH and SKOV-3 transduced with DNA-PK or ctrl shRNA. E. BUB1 protein expression in MDAH cells treated for 18 h with 10 µM of NU7441 alone or in combination with 200 nM of Nocodazole. Vinculin was used as loading control in all western blots.
Figure 8
Figure 8
Stathmin overexpression identifies low-surviving ovarian cancer patients. Source data is available for this figure in the Supporting Information. A. Representative immunohistochemical staining of formalin-fixed, paraffin-embedded EOC tissue sections negative/moderate (panel 1: serous G3; panel 2: endometrioid G2) and high (panel 3: serous G2; panel 4: serous G3) for stathmin expression. Original magnification 200×. B. Representative Western blot analyses of p53, stathmin and DNA-PK expression in total protein extracts from primary high-grade serous carcinoma samples. C–E. Spearman's correlation analysis between stathmin and DNA-PK (C), p53 and stathmin (D) or p53 and DNA-PK (E) expression in primary serous carcinomas. F. Co-immunoprecipitation of p53 and DNA-PK in primary high-grade serous carcinoma samples. Total protein lysates from tumours expressing high (lanes 1, 2) or low (lanes 3,4) levels of stathmin expression (input, lower panels) were immunoprecipitated using anti-p53 antibody and then immunoblotted using anti-DNA-PK and anti-p53 antibodies, as indicated. G. Kaplan Meyer estimate of overall (left) and progression free (right) survival, following stratification for stathmin expression. p values were calculated using the log-rank test. H. Schematic representation depicting the role of stathmin in EOC carrying a p53MUT protein. High stathmin levels in EOC are necessary for proper expression of DNA-PK that, in turn, positively regulates p53MUT stability and transcriptional activity through S15/S37 phosphorylation.

Similar articles

Cited by

References

    1. Anglesio MS, Arnold JM, George J, Tinker AV, Tothill R, Waddell N, Simms L, Locandro B, Fereday S, Traficante N, et al. Mutation of ERBB2 provides a novel alternative mechanism for the ubiquitous activation of RAS-MAPK in ovarian serous low malignant potential tumors. Mol Cancer Res. 2008;6:1678–1690. - PMC - PubMed
    1. Belletti B, Baldassarre G. Stathmin: a protein with many tasks. New biomarker and potential target in cancer. Expert Opin Ther Targets. 2011;15:1249–1266. - PubMed
    1. Cabello OA, Eliseeva E, He WG, Youssoufian H, Plon SE, Brinkley BR, Belmont JW. Cell cycle-dependent expression and nucleolar localization of hCAP-H. Mol Biol Cell. 2001;12:3527–3537. - PMC - PubMed
    1. Cassimeris L. The oncoprotein 18/stathmin family of microtubule destabilizers. Curr Opin Cell Biol. 2002;14:18–24. - PubMed
    1. Cassinelli G, Supino R, Perego P, Polizzi D, Lanzi C, Pratesi G, Zunino F. A role for loss of p53 function in sensitivity of ovarian carcinoma cells to taxanes. Int J Cancer. 2001;92:738–747. - PubMed

Publication types

MeSH terms