. 2013 May 6;210(5):905-15.
doi: 10.1084/jem.20121130. Epub 2013 Apr 22.

Role of host cell traversal by the malaria sporozoite during liver infection

Affiliations

Role of host cell traversal by the malaria sporozoite during liver infection

Joana Tavares et al. J Exp Med. .

Abstract

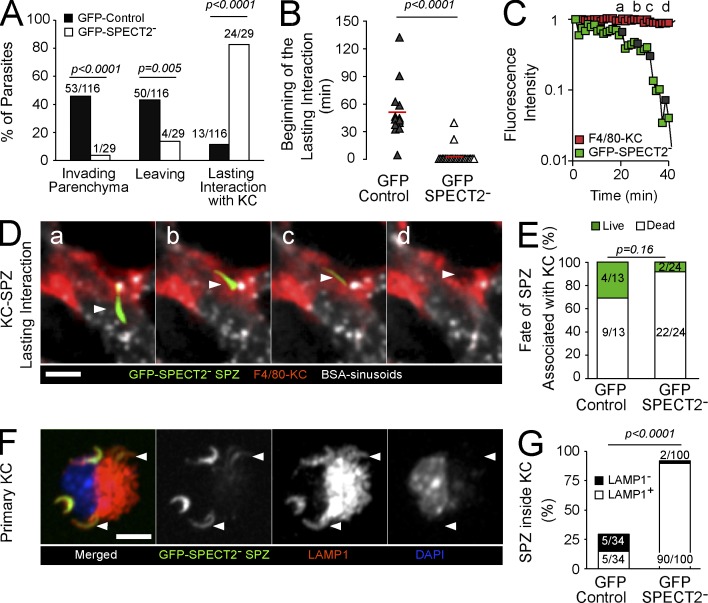
Malaria infection starts when the sporozoite stage of the Plasmodium parasite is injected into the skin by a mosquito. Sporozoites are known to traverse host cells before finally invading a hepatocyte and multiplying into erythrocyte-infecting forms, but how sporozoites reach hepatocytes in the liver and the role of host cell traversal (CT) remain unclear. We report the first quantitative imaging study of sporozoite liver infection in rodents. We show that sporozoites can cross the liver sinusoidal barrier by multiple mechanisms, targeting Kupffer cells (KC) or endothelial cells and associated or not with the parasite CT activity. We also show that the primary role of CT is to inhibit sporozoite clearance by KC during locomotion inside the sinusoid lumen, before crossing the barrier. By being involved in multiple steps of the sporozoite journey from the skin to the final hepatocyte, the parasite proteins mediating host CT emerge as ideal antibody targets for vaccination against the parasite.


Figures

Figure 1.
Figure 1.
Crossing of the liver sinusoidal barrier by Plasmodium sporozoites. (A) Intravital imaging of the sinusoidal barrier in an flk1-gfp mouse injected intravenously with Alexa Fluor 647 anti-F4/80 antibody. GFP-expressing ECs and F4/80-labeled KCs are pseudo-colored in white and red, respectively (left). KC labeling specificity was confirmed by clodronate-depletion of phagocytic cells (middle) and by colocalization of phagocytosed fluorescent microspheres (beads in green) with F4/80 labeling (right). Images are maximal Z-projections of five contiguous pictures separated by 5 µm. Bar, 20 µm. (B) KC detection in lys-egfp mice. Intravital imaging of the liver of lys-egfp mouse injected intravenously with Alexa Fluor 647 anti-F4/80 antibody. Neutrophils (green arrowheads) and KCs (yellow arrowheads) are identified by GFPhigh and GFPlow fluorescence intensities, respectively. F4/80-positive cells (pseudo-colored in red) expressing no detectable GFP are indicated by white arrowheads. Images are maximal Z-projections of three contiguous pictures separated by 5 µm. Bar, 20 µm. (C) Intravital imaging of KC-sporozoite association during sporozoite crossing. The pictures show the trajectories of RFP+ sporozoites leaving the sinusoidal lumen and invading the hepatic parenchyma (SPZ projection in green) and are representative of the behavior scored as crossing events. KC+ indicates the presence of a KC matching, or adjacent to, the crossing site (yellow arrowhead, left panel). KC indicates the absence of a KC at the invasion site (yellow arrowhead, right). The images are maximal Z-projections of three contiguous pictures separated by 5 µm and T-projected for 30 and 42 s, respectively. Asterisks indicate the final position of the parasite in the parenchyma. Bar, 10 µm. The graph shows the quantification of the KC+ and KC crossing events (60 individual crossing events obtained from 25 independent experiments).
Figure 2.
Figure 2.
Crossing the liver sinusoidal barrier by EC traversal. (A–C) Time-lapse intravital confocal microscopy of RFP+ sporozoites (green) crossing the liver sinusoidal barrier through (white) ECs (yellow arrowhead) in flk1-gfp mice harboring (red) F4/80-labeled KCs. The white arrowheads indicate the decrease of EC-GFP fluorescence after sporozoite crossing. Images (left) are Z-projections of three contiguous pictures separated by 5 µm. Asterisks indicate the anterior poles of sporozoites. Bars, 10 µm. Graphs (right) show the quantification of normalized GFP mean intensity of ECs at the crossing site (white triangles) and in at least seven ECs from the same field and focal plane that did not interact with the parasite (green triangles, mean ± SD). The red lines represent the lower tolerance limit for 95% of the population. Dark triangles, black bars, and letters (a–d) represent the respective time-lapse images. (D and E) Quantification of crossing events by sporozoites injected via intravenous injection (D) or mosquito bite (E), classified by KC association and EC fading phenotypes. Sporozoites were delivered by intravenous injection (A, B, and D; n = 60 events from the same 25 independent experiments analyzed in Fig. 1 C) or mosquito bite (C and E; n = 8 from 15 independent experiments).
Figure 3.
Figure 3.
Fading of GFP+ ECs is a result of sporozoite CT activity. (A) Time-lapse microscopy of a sporozoite (SPZ, red) traversing and triggering the specific decrease of the fluorescence intensity of a primary liver sinusoidal EC (green) isolated from an flk1-gfp mouse. The graph quantifies EC fading based on the normalized GFP mean intensity of the traversed EC (white triangles). The EC fading control (green triangles) corresponds to adjacent ECs in the same microscopic field. Pictures are representative of 10 independent experiments. Bar, 10 µm. (B) Time-lapse microscopy of a sporozoite (red) traversing a primary GFP+ EC (green) in the presence of PI. The fading of the GFP+ EC is simultaneous to the nuclear incorporation of PI in the traversed EC (red), as observed in the images and quantified in the graph. In the graph, red circles and white triangles represent the normalized PI and GFP mean fluorescence intensities of the traversed EC, respectively. The fading control is represented by green triangles. Bar, 10 µm. In A and B, dark triangles and letters (a–d) represent the projected time-lapse images in the graph. Asterisks indicate the anterior pole of sporozoites. Pictures are representative of five independent experiments. (C) Primary GFP+ ECs were incubated with control sporozoites (GFP+ control, white circles) or CT-deficient sporozoites (GFP+ SPECT2, black squares) and imaged dynamically by wide-field fluorescence microscopy. After 90 min of interaction, the percentage of faded GFP+ ECs (yellow arrowhead, red cells) was quantified and plotted according to the ratio of sporozoite per cell in the microscopic field. Pictures are representative of five independent experiments. Bar, 20 µm.
Figure 4.
Figure 4.
KC-related crossing of the liver sinusoidal barrier. (A–C) RFP+ sporozoites were intravenously injected in flk1-gfp mice labeled with anti-F4/80 antibody and imaged in liver sinusoids in the presence of PI in 20 independent experiments. (A) Time lapse of a sporozoite (green) crossing the barrier (yellow arrowhead) through EC traversal, with simultaneous EC fading (white arrowheads) and PI incorporation (green arrowheads, ECPI+). The graph shows the simultaneous loss of the normalized GFP+ EC fluorescence intensity and the increase of the PI fluorescence intensity in the EC nucleus. Dark triangles and letters (a–d) represent the respective time-lapse images in the graph. (B) Time lapse of a sporozoite (green) crossing the barrier through KC traversal (yellow arrowheads) visualized by the nuclear PI incorporation in the traversed KC (green arrowheads, KCPI+). (C) Time lapse of a KC+ crossing event (yellow arrowheads) without PI incorporation in the KC (green arrowheads, KCPI). In B and C, white arrowheads indicate EC lining the site of crossing that did not fade or become PI+ during crossing. Images are maximal Z-projections of three contiguous planes separated by 5 µm. T-projections are indicated at the panel bottom (white time interval). Asterisks mark the anterior pole of sporozoites. Bars, 10 µm. (D) Quantification of the crossing events through KC traversal, represented by the phenotype KCPI+, ECfad/ECPI (green bar).
Figure 5.
Figure 5.
CT-independent crossing of the liver sinusoidal barrier. (A) Time-lapse intravital confocal microscopy of sporozoites (green) crossing the barrier via (white) ECs in a flk1-gfp mouse harboring (red) F4/80-labeled KCs. White and blue arrowheads show the EC+ GFP fluorescence after sporozoite crossing (yellow arrowheads). Red arrowheads show a PI positive KC. Images are Z-projections of three contiguous pictures separated by 5 µm. Bar, 10 µm. The graph shows the quantification of normalized GFP mean intensity of the two ECs in the vicinity of the crossing site (white and blue triangles) and in seven ECs from the same field and focal plane that did not interact with the parasite (green triangles, mean ± SD). The red line represents the lower tolerance limit of 95% of the population. (B) SPECT2 sporozoite infectivity in C57BL/6 mice after depletion of KCs by intravenous injection of clodronate liposomes 2 or 5 d before infection. Control mice received PBS. Groups of mice (n = 4) were infected intravenously with 2 × 10⁴ GFP+ control or GFP+ SPECT2 sporozoites and parasitemia was quantified by FACS analysis at day 5 after infection. A representative experiment from three independent experiments is shown. The bars and error bars represent the mean parasitemia and one SD, respectively. (C) Percentage of GFP+ control and GFP+ SPECT2 sporozoites in the liver parenchyma and sinusoidal lumen. 2 h after intravenous injection of parasites in C57BL/6 mice depleted of phagocytic cells, sporozoites were counted by intravital confocal microscopy in 30 fields of 125 × 125 × 40 µm3 each. (D and E) Time lapses representative of CT-deficient sporozoites (green, GFP+ SPECT2) crossing the liver sinusoidal barrier (red, Alexa Fluor 555-BSA) of C57BL/6 mice in which phagocytic cells were depleted by clodronate treatment. Images are maximal Z-projections of three contiguous planes separated by 5 µm. Asterisks indicate the anterior pole of sporozoites and yellow and white arrowheads indicate the sporozoite crossing site and the dynamics of BSA+ endocytic vesicles, respectively. The area delineated by dotted lines is the lumen of the sinusoid. Bars, 10 µm.
Figure 6.
Figure 6.
Sporozoites gliding in the sinusoids wound and kill KCs. (A and B) RFP+ sporozoites (green) were intravenously injected in flk1-gfp mice labeled with anti-F4/80 antibody and imaged in the presence of PI 5 mg/kg (green) in the liver sinusoids by intravital confocal microscopy. Time lapses are representative of the two types of transitory interaction of sporozoites with KCs (red) in the sinusoid lumen. Images are maximal Z-projections of three contiguous planes separated by 5 µm and T-projected according to the time indicated in white (bottom right corner). Asterisks indicate the anterior pole of sporozoites. Green and white arrowheads point to the nuclei of KCs that became PI+ (KCPI+) and PI (KCPI) upon interaction with sporozoites, respectively. (C and D) Quantification of the percentage of KCs that incorporate PI upon transitory interaction with control (C) or SPECT2 (D) sporozoites. (E) Fate of a traversed KC, monitored by PI incorporation (0–584 s) and after 1 h by incorporation of SYTOX-Green injected intravenously (1 µmol/kg). (F) Of the nine traversed KCs identified by PI incorporation, seven incorporated SYTOX-Green after 1 h (n = 9 from five independent experiments). Bars, 10 µm.
Figure 7.
Figure 7.
CT prevents sporozoite clearance by KCs in the liver sinusoids. (A) Percentage of sporozoites (GFP+ control, black symbols; GFP+ SPECT2, white symbols) lying in the parenchyma (invading parenchyma) or associated with KCs (lasting interaction with KC) after 150 min of recording, and of sporozoites that left the field during the recording (leaving). P-values were determined by Fischer’s exact test. (B) Graph indicating when sporozoites started the lasting interaction with KC (red bars, mean). P-values were determined by Wilcoxon rank-sum test. (C) Graph quantifying the fluorescence intensity of GFP+ SPECT2 sporozoites (green) or F4/80-labeled KC (red) normalized to the initial time point. Dark squares and letters (a–d) in the graph represent the respective time-lapse images from D. (D) Representative time-lapse of a KC-SPECT2 sporozoite lasting interaction leading to a gradual decrease in sporozoite fluorescence intensity (white arrowheads). Sporozoites were intravenously injected in mice labeled with anti-F4/80 antibody (KCs in red) and Alexa Fluor 555 BSA (sinusoids in white). (E) Percentage of parasites presenting a >10-fold decrease in the initial GFP intensity signal during the lasting association with KCs, scored as dead sporozoites (dead SPZ, white bars). (F and G) GFP+ control and GFP+ SPECT2 sporozoites were incubated in vitro with primary KCs for 1 h, and cells were fixed and stained with anti-CS 3D11 monoclonal antibody conjugated with Alexa Fluor 647 to discriminate between intracellular (GFP+) and extracellular (GFP+CS+) parasites. Cells were then permeabilized and stained with monoclonal antibodies to LAMP1 (clone 1D4B). (F) GFP+ SPECT2 sporozoites inside a primary KC are in LAMP1-positive compartments. White arrowheads indicate sporozoites with reduced GFP fluorescence. Images are maximal Z-projections of 10 contiguous pictures separated by 1 µm. (G) Graph showing the quantification of GFP+ control and GFP+ SPECT2 sporozoites that are inside KCs in LAMP1-positive or -negative compartments. (D and F) Bars, 10 µm.

References

    1. Amino R., Thiberge S., Martin B., Celli S., Shorte S., Frischknecht F., Ménard R. 2006. Quantitative imaging of Plasmodium transmission from mosquito to mammal. Nat. Med. 12:220–224 10.1038/nm1350 - DOI - PubMed
    1. Amino R., Thiberge S., Blazquez S., Baldacci P., Renaud O., Shorte S., Ménard R. 2007. Imaging malaria sporozoites in the dermis of the mammalian host. Nat. Protoc. 2:1705–1712 10.1038/nprot.2007.120 - DOI - PubMed
    1. Amino R., Giovannini D., Thiberge S., Gueirard P., Boisson B., Dubremetz J.F., Prévost M.C., Ishino T., Yuda M., Ménard R. 2008. Host cell traversal is important for progression of the malaria parasite through the dermis to the liver. Cell Host Microbe. 3:88–96 10.1016/j.chom.2007.12.007 - DOI - PubMed
    1. Baer K., Roosevelt M., Clarkson A.B., Jr, van Rooijen N., Schnieder T., Frevert U. 2007. Kupffer cells are obligatory for Plasmodium yoelii sporozoite infection of the liver. Cell. Microbiol. 9:397–412 10.1111/j.1462-5822.2006.00798.x - DOI - PubMed
    1. Barragan A., Brossier F., Sibley L.D. 2005. Transepithelial migration of Toxoplasma gondii involves an interaction of intercellular adhesion molecule 1 (ICAM-1) with the parasite adhesin MIC2. Cell. Microbiol. 7:561–568 10.1111/j.1462-5822.2005.00486.x - DOI - PubMed

Publication types

MeSH terms

Substances