. 2013 May 30;121(22):4575-85.
doi: 10.1182/blood-2013-01-479451. Epub 2013 Apr 22.

Ldb1-nucleated transcription complexes function as primary mediators of global erythroid gene activation

Affiliations

Ldb1-nucleated transcription complexes function as primary mediators of global erythroid gene activation

LiQi Li et al. Blood. .

Abstract

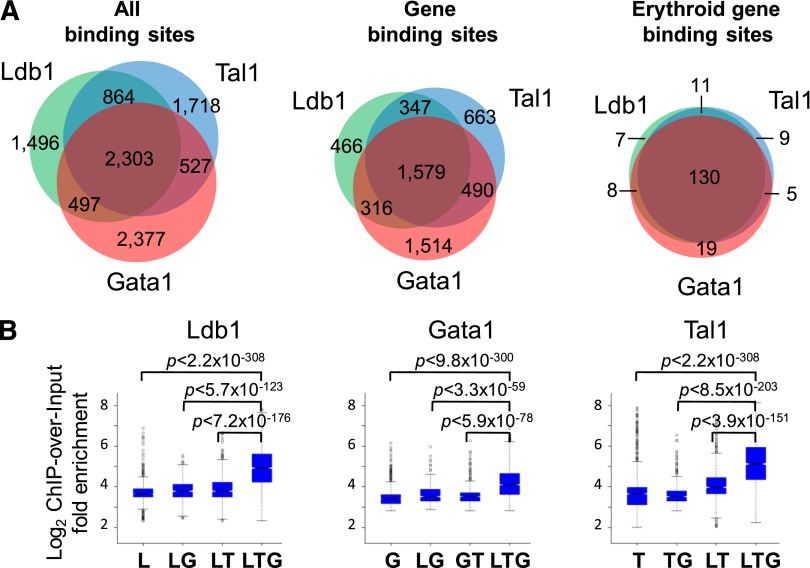
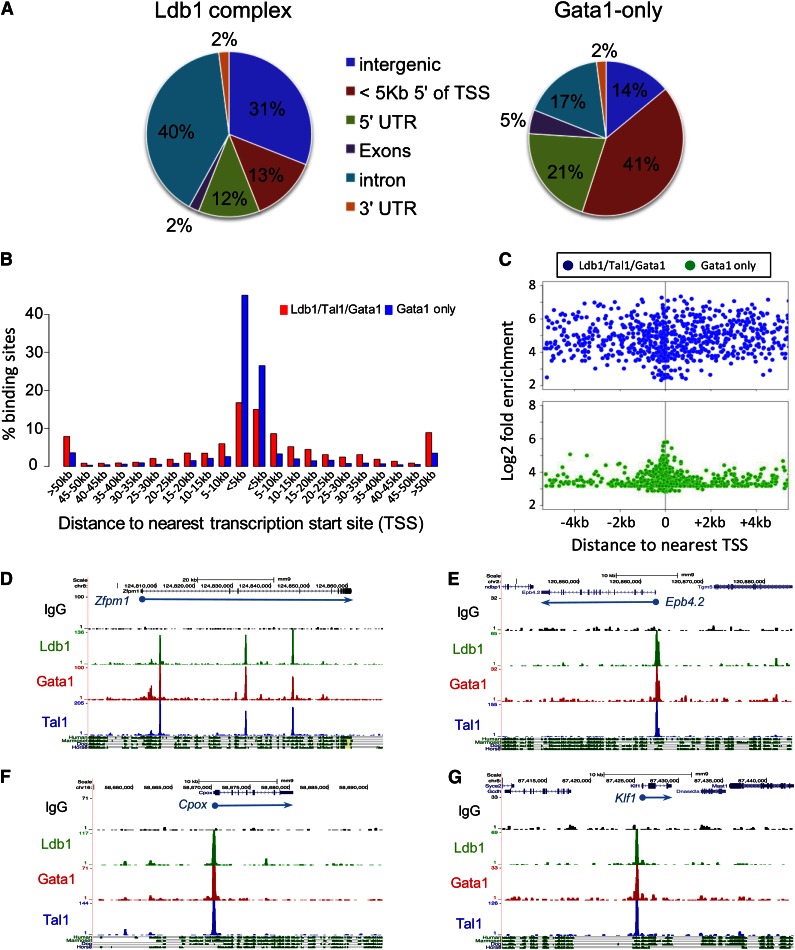
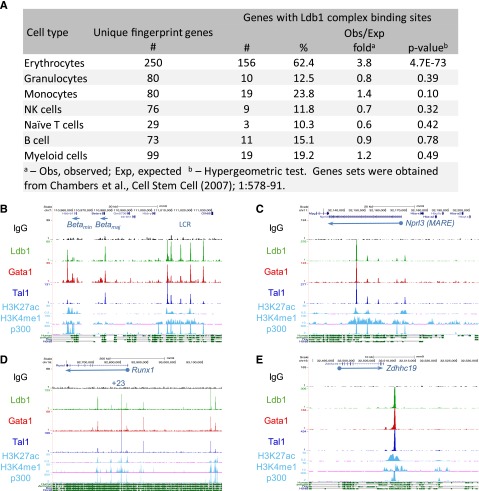
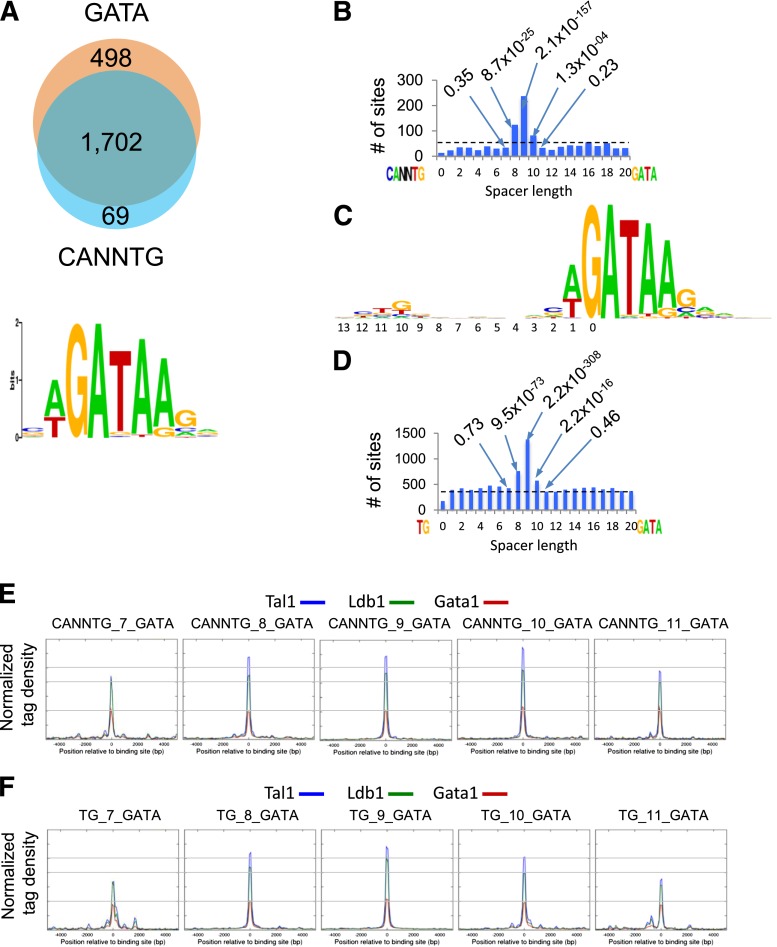
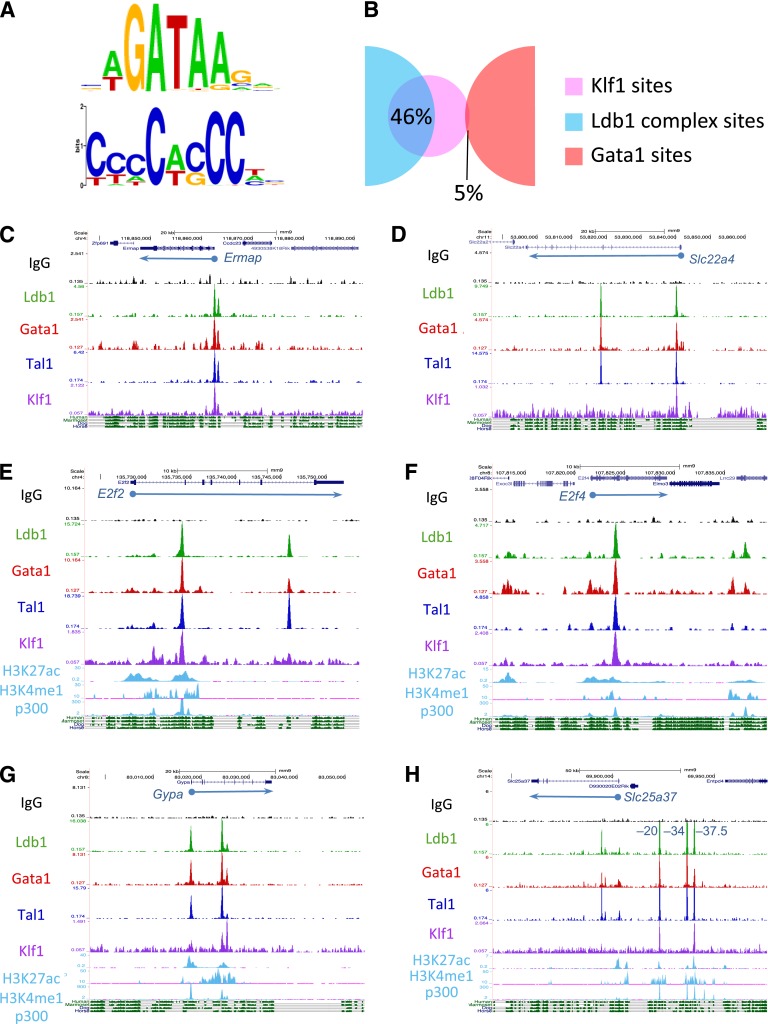
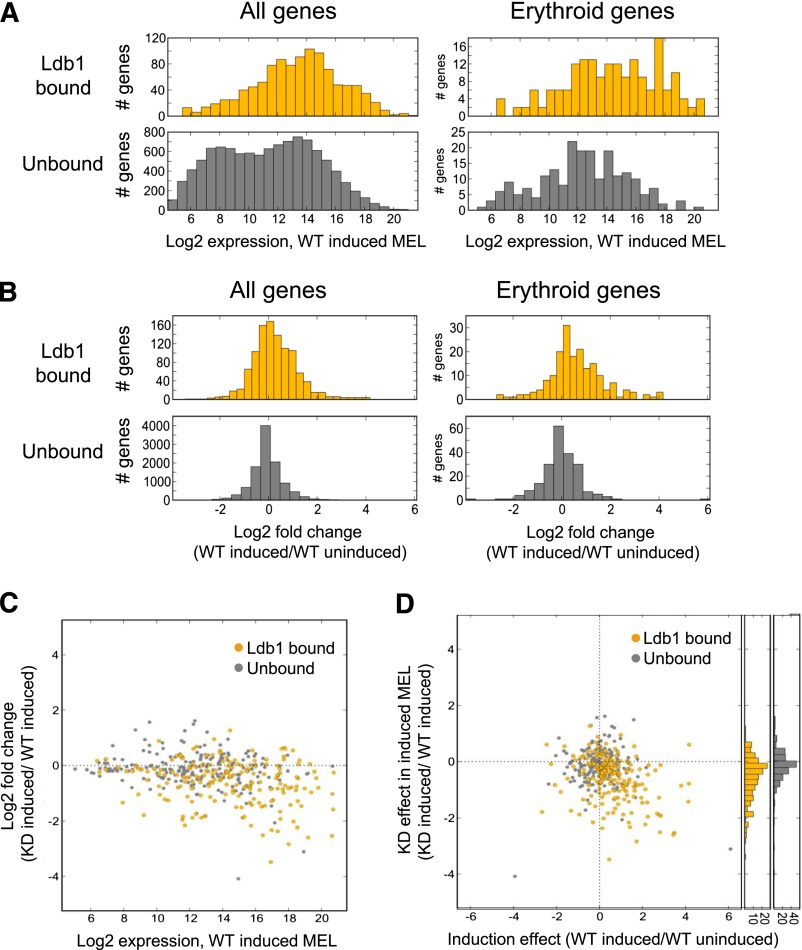
Erythropoiesis is dependent on the lineage-specific transcription factors Gata1, Tal1, and Klf1. Several erythroid genes have been shown to require all 3 factors for their expression, suggesting that they function synergistically; however, there is little direct evidence for widespread cooperation. Gata1 and Tal1 can assemble within higher-order protein complexes (Ldb1 complexes) that include the adapter molecules Lmo2 and Ldb1. Ldb1 proteins are capable of coassociation, and long-range Ldb1-mediated oligomerization of enhancer- and promoter-bound Ldb1 complexes has been shown to be required for β-globin gene expression. In this study, we generated a genomewide map of Ldb1 complex binding sites that revealed widespread binding at erythroid genes and at known erythroid enhancer elements. Ldb1 complex binding sites frequently colocalized with Klf1 binding sites and with consensus binding motifs for other erythroid transcription factors. Transcriptomic analysis demonstrated a strong correlation between Ldb1 complex binding and Ldb1 dependency for gene expression and identified a large cohort of genes coregulated by Ldb1 complexes and Klf1. Together, these results provide a foundation for defining the mechanism and scope of Ldb1 complex activity during erythropoiesis.


Figures

Figure 1
Figure 1
ChIP-Seq analysis of Ldb1/Tal1/Gata1 complexes (Ldb1 complexes). (A) Frequency of colocalized Ldb1, Tal1, and Gata1 binding sites. Shown are (left) all sites , (center) gene binding sites, and (right) erythroid fingerprint gene binding sites. Gene binding sites are defined as those sites within 5 kb of a TSS or within a gene body. Erythroid fingerprint genes are as described. (B) ChIP-over-input fold enrichment at Ldb1, Tal1, and Gata1 binding sites. G, Gata1; L, Ldb1; T, Tal1.
Figure 2
Figure 2
Location of Ldb1 complex binding sites. (A) Genomic distribution of (left) Ldb1 complex binding sites or (right) non-Ldb1/Tal1-associated (Gata1 only) binding sites. (B) Location of all Ldb1 complex binding sites and Gata1-only binding sites relative to the nearest gene. Bar heights indicate percentage of all Ldb1 complex binding sites (red) or non-Ldb1/Tal1 associated Gata1-only binding sites (blue) that map to the indicated distance from a known gene. (C) Distribution of all Ldb1 complex binding sites (blue) and all Gata1-only binding sites (green) located within 4 kb of a TSS. y-axis shows Log2 fold enrichment of ChIP-Seq tag number/input tag number. (D-G) UCSC Genome Browser shots showing Ldb1, Tal1, and Gata1 binding sites at (D) Zfpm1 (Fog1), (E) Epb4.2, (F) Cpox, and (G) Klf1. y-axis shows number of sequence reads. Mammalian conservation tracks are shown at the bottom.
Figure 3
Figure 3
Enrichment of Ldb1 complex binding sites at erythroid genes and erythroid cis-regulatory elements. (A) Ldb1 complex binding sites at erythroid “fingerprint” genes. (B-E) UCSC Genome Browser shots of Ldb1 complex binding at known or presumed cis-regulatory elements: (B) β-globin LCR, (C) α-globin (MARE) cis-regulatory region, (D) Runx1 locus, and (E) presumed cis-regulatory element near Zdhhc19. Binding sites for p300 and H3K27ac, H3K4me1 profiles in MEL cells, and mammalian conservation tracks are shown at the bottom.
Figure 4
Figure 4
Sequence analysis of Ldb1 complex–bound DNA fragments. (A) (Upper) Number of Ldb1 complex–bound fragments with GATA and/or E-box (CANNTG) motifs. (Lower) Consensus GATA motif within Ldb1 complex–bound DNA fragments discovered by MEME de novo motif search. (B) Number of Ldb1 complex binding sites that contain paired CANNTG/GATA motifs separated by 0-20 bp. Dotted line represents the expected number of peaks (binding sites) in randomly selected sites. Numbers in the plot represent P values of bars denoting fragments with the indicated number of base pairs separating the CANNTG and GATA motifs. (C) Consensus logo generated from the top 1000 Ldb1 complex binding sites. (D) Number of Ldb1 complex binding sites that contain paired TG/GATA motifs separated by 0-20 bp. Dotted line represents the expected number of peaks (binding sites) in randomly selected sites. Numbers in the plot represent P values of bars denoting fragments with the indicated number of base pairs separating the TG and GATA motifs. (E) Average Ldb1, Tal1, and Gata1 ChIP-Seq tag numbers for Ldb1 complexes bound to sites containing CANNTG from 7-11 bp 5-prime of a GATA. (F) Average Ldb1, Tal1, and Gata1 ChIP-Seq tag numbers for Ldb1 complexes bound to sites containing TG from 7-11 bp 5-prime of a GATA.
Figure 5
Figure 5
Ldb1 complexes bind at sites near those for Klf1. (A) GATA and CACC consensus motifs identified within Ldb1 complex–bound DNA fragments by MEME de novo motif search. (B) Overlap of the Klf1 binding sites from Tallack et al with Ldb1 complex (Ldb1/Tal1/Gata1) binding sites or with non-Ldb1/Tal1-associated Gata1-only binding sites. (C-H) UCSC Genome browser shots showing colocalized Ldb1, Tal1, Gata1, and Klf1 binding sites at (C) Ermap, (D) Slc22a4, (E) E2f2, (F) E2f4, (G) Gypa, and (H) Slc25a37 (positions of known cis-regulatory elements are indicated). Numbers on y-axis are number of sequence reads. Tracks for H3K27ac, H3K4me1, and p300 in MEL cells and mammalian conservation tracks are shown at the bottom.
Figure 6
Figure 6
Direct regulatory function for Ldb1 complexes in the induced expression of erythroid genes in MEL cells. (A) Ldb1 complex–bound genes are more highly expressed in differentiated MEL cells. (Left) All Ldb1-bound genes (yellow, upper panel) compared with all unbound genes (gray, lower panel), P < 7.7 × 10−74. (Right) Erythroid Ldb1 complex–bound genes (yellow, upper panel) compared with unbound erythroid genes (gray, lower panel), P < 1.4 × 10⁻⁹. (B) Ldb1 complex–bound genes are more strongly induced in differentiated MEL cells. (Left) All Ldb1 complex–bound genes (yellow, upper panel) compared with all unbound genes (gray, lower panel), P < 1.0 × 10⁻³². (Right) Ldb1 complex–bound erythroid genes (yellow, upper panel) compared with unbound erythroid genes (gray, lower panel), P < 7.9 × 10⁻¹¹. Significance for all comparisons was calculated by Mann-Whitney U. (C-D) Ldb1-complexes directly regulate the expression of erythroid genes. Stable clones of MEL cells expressing Ldb1 shRNA or control shRNA were treated with 1.5% dimethylsulfoxide to induce erythroid differentiation. Total RNA was isolated and gene expression was assayed by microarray. (C) Highly expressed erythroid genes are the most strongly down-regulated in Ldb1 KD MEL cells. Genes bound by Ldb1 complexes are depicted in yellow; unbound genes are in gray. Zero line is indicated (dotted line). (D) Erythroid genes that are most strongly induced in differentiated control MEL cells are the most strongly down-regulated in Ldb1 KD MEL cells. Erythroid genes bound by Ldb1 complex are shown in yellow; unbound genes are shown in gray. Zero lines are indicated (dotted lines). y-axis histograms show stronger KD of Ldb1 complex–bound erythroid genes relative to all erythroid unbound genes, respectively (P < 6.7 × 10⁻¹⁰; Mann-Whitney U).

Similar articles

Cited by

References

    1. Schlaeger TM, Mikkola HK, Gekas C, Helgadottir HB, Orkin SH. Tie2Cre-mediated gene ablation defines the stem-cell leukemia gene (SCL/tal1)-dependent window during hematopoietic stem-cell development. Blood. 2005;105(10):3871–3874. - PubMed
    1. Pevny L, Simon MC, Robertson E, et al. Erythroid differentiation in chimaeric mice blocked by a targeted mutation in the gene for transcription factor GATA-1. Nature. 1991;349(6306):257–260. - PubMed
    1. Hodge D, Coghill E, Keys J, et al. A global role for EKLF in definitive and primitive erythropoiesis. Blood. 2006;107(8):3359–3370. - PMC - PubMed
    1. Kassouf MT, Hughes JR, Taylor S, et al. Genome-wide identification of TAL1’s functional targets: insights into its mechanisms of action in primary erythroid cells. Genome Res. 2010;20(8):1064–1083. - PMC - PubMed
    1. Welch JJ, Watts JA, Vakoc CR, et al. Global regulation of erythroid gene expression by transcription factor GATA-1. Blood. 2004;104(10):3136–3147. - PubMed

Publication types

MeSH terms

Substances