. 2013 May 7;110(19):7574-9.
doi: 10.1073/pnas.1215582110. Epub 2013 Apr 22.

Origin of seasonal predictability for summer climate over the Northwestern Pacific

Affiliations

Origin of seasonal predictability for summer climate over the Northwestern Pacific

Yu Kosaka et al. Proc Natl Acad Sci U S A. .

Abstract

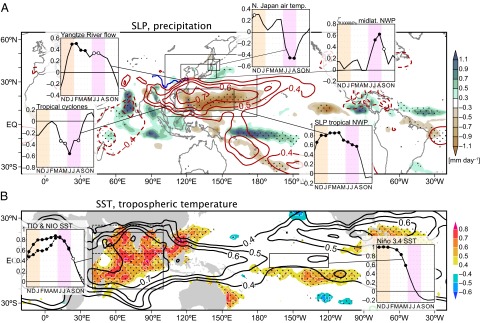
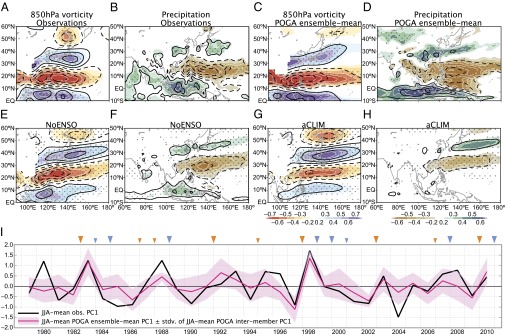
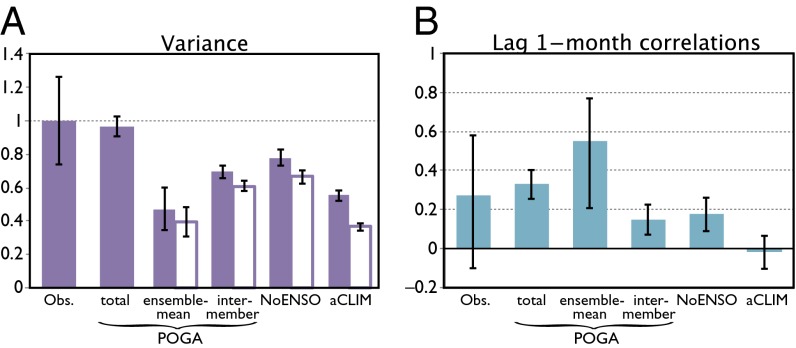
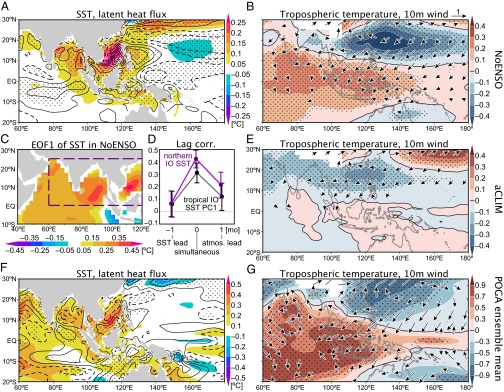
Summer climate in the Northwestern Pacific (NWP) displays large year-to-year variability, affecting densely populated Southeast and East Asia by impacting precipitation, temperature, and tropical cyclones. The Pacific-Japan (PJ) teleconnection pattern provides a crucial link of high predictability from the tropics to East Asia. Using coupled climate model experiments, we show that the PJ pattern is the atmospheric manifestation of an air-sea coupled mode spanning the Indo-NWP warm pool. The PJ pattern forces the Indian Ocean (IO) via a westward propagating atmospheric Rossby wave. In response, IO sea surface temperature feeds back and reinforces the PJ pattern via a tropospheric Kelvin wave. Ocean coupling increases both the amplitude and temporal persistence of the PJ pattern. Cross-correlation of ocean-atmospheric anomalies confirms the coupled nature of this PJIO mode. The ocean-atmosphere feedback explains why the last echoes of El Niño-Southern Oscillation are found in the IO-NWP in the form of the PJIO mode. We demonstrate that the PJIO mode is indeed highly predictable; a characteristic that can enable benefits to society.

Keywords: East Asian summer monsoon; air–sea interaction; interbasin interaction; tropical variability.


Conflict of interest statement

The authors declare no conflict of interest.

Figures

Fig. 1.
Fig. 1.
Observed correlations and regressed anomalies with respect to NDJ Niño 3.4 SST. (A and B) Precipitation regressions (shading) and SLP correlations (contours) (A) and correlations of SST (shading) and tropospheric temperature (contours) (B) in subsequent JJA. Stippling indicates 95% confidence of shaded fields. Contours are drawn for ±0.4, ±0.5, ±0.6, …. Insets show 3-mo running correlations for ENSO-peak to -decay seasons. (A, anticlockwise from top left) Yangtze River flow, TC genesis, SLP over [10°–25°N, 110°–160°E], 1,000-hPa vorticity over [32.5°–42.5°N, 115°–145°E], and land-surface air temperature over [38°–46°N, 138°–148°E]. (B) (Left to Right) Tropical (20°S–20°N, 40°–100°E; solid lines) and northern (5°–25°N, 40°–100°E; dashed lines) IO and Niño 3.4 SST. Open (solid) circles indicate 90% (95%) confidence.
Fig. 2.
Fig. 2.
(A–H) Anomalies of (A, C, E, and G) 850-hPa vorticity and (B, D, F, and H) precipitation associated with EOF1s of NWP 850-hPa vorticity. Shown are (A and B) observations, (C and D) POGA ensemble mean, (E and F) NoENSO, and (G and H) aCLIM. Shading indicates correlations, with stippling representing 95% statistical confidence, whereas contours show regressed anomalies, all with respect to PC1s. Contours are plotted for (A, C, E, and G) ±0.5, ±1.5, ±2.5, … ×10−6 s–1 and (B, D, F, and H) ±0.5, ±1.5, ±2.5, … mm⋅d–1. (I) The corresponding PC1 time series in observations (black) and POGA (red), averaged for JJA. Shading represents ±1 SD of intermember PC1 in POGA. Orange and blue triangles at the top indicate El Niño and La Niña events (large triangles, strong to moderate; small triangles, weak), respectively, based on NDJ Niño 3.4 SST.
Fig. 3.
Fig. 3.
(A) Variance explained by (solid bars) EOF1 of individual variability and (open bars) projections onto the EOF1 pattern of POGA total variability, both scaled with variance of observational EOF1 (Materials and Methods). (B) One-month–lagged autocorrelations of PC1s. Error bars (A) are derived from North’s rule and (B) represent 95% intervals.
Fig. 4.
Fig. 4.
(A, B, and E–G) Regressed anomalies of (A and F) SST (shading) and latent head flux (contours; positive downward), and (B, E, and G) correlations of tropospheric temperature (shading) and 10-m wind velocity (arrows) in JJA, against (A and B) NoENSO PC1, (E) aCLIM PC1, and (F and G) Niño 3.4 SST in preceding NDJ in ensemble-mean POGA. Contours in A and F are drawn for ±1, ±3, ±5, … W⋅m–2. Stippling indicates 95% confidence of (A and F) latent heat flux and (B, E, and G) tropospheric temperature. In G, the tropical (30°S–30°N) average has been removed from tropospheric temperature. (C and D) SST EOF1 in the tropical IO (C) and lead–lag correlations of the corresponding PC and SST in [0°–25°N, 60°–120°E] (D) with PC1 of NWP 850-hPa vorticity in NoENSO. Error bars represent 95% intervals.
Fig. 5.
Fig. 5.
(A–F) Anomalies of (A, C, and E) SST (shading), (B, D, and F) precipitation (shading), and 850-hPa wind velocity (arrows) regressed onto SVD1s of IO SST and NWP 850-hPa vorticity in JJA, based on (A and B) observations and (C and D) MME mean and (E and F) grand ensemble of intermember variance of seasonal predictions. Contours in A indicate tropospheric temperature correlation with its tropical (30°S–30°N) average subtracted and are drawn for ±0.1, ±0.2, ±0.3, …. Stippling indicates 95% statistical confidence of shaded fields.

References

    1. Hosoe N. Crop failure, price regulation, and emergency imports of Japan’s rice sector in 1993. Appl Econ. 2004;36(10):1051–1056.
    1. Zong Y, Chen X. The 1998 flood on Yangtze, China. Nat Hazards. 2000;22(2):165–184.
    1. Chowdary JS, et al. Predictability of Northwest Pacific climate during summer and the role of the tropical Indian Ocean. Clim Dyn. 2011;36(3-4):607–621.
    1. Larkin NK, Harrison DE. ENSO warm (El Niño) and cold (La Niña) event life cycles: Ocean surface anomaly patterns, their symmetries, asymmetries, and implications. J Clim. 2002;15(10):1118–1140.
    1. Klein SA, Soden BJ, Lau N-C. Remote sea surface temperature variations during ENSO: Evidence for a tropical atmospheric bridge. J Clim. 1999;12(4):917–932.

Publication types

LinkOut - more resources