. 2013 May 7;110(19):7820-5.
doi: 10.1073/pnas.1218599110. Epub 2013 Apr 22.

Immune-responsive gene 1 protein links metabolism to immunity by catalyzing itaconic acid production

Affiliations

Immune-responsive gene 1 protein links metabolism to immunity by catalyzing itaconic acid production

Alessandro Michelucci et al. Proc Natl Acad Sci U S A. .

Abstract

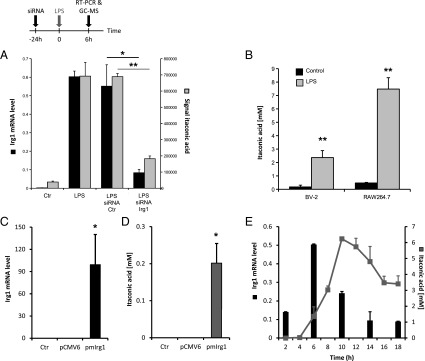
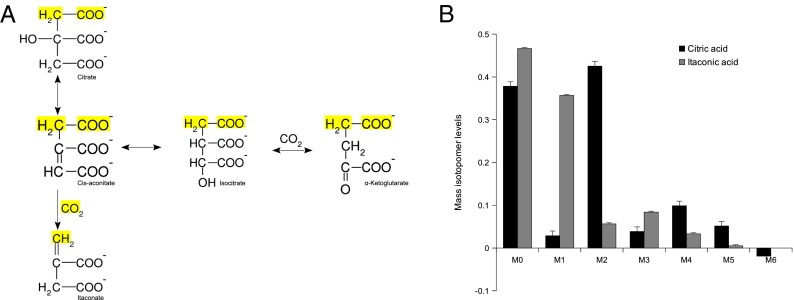
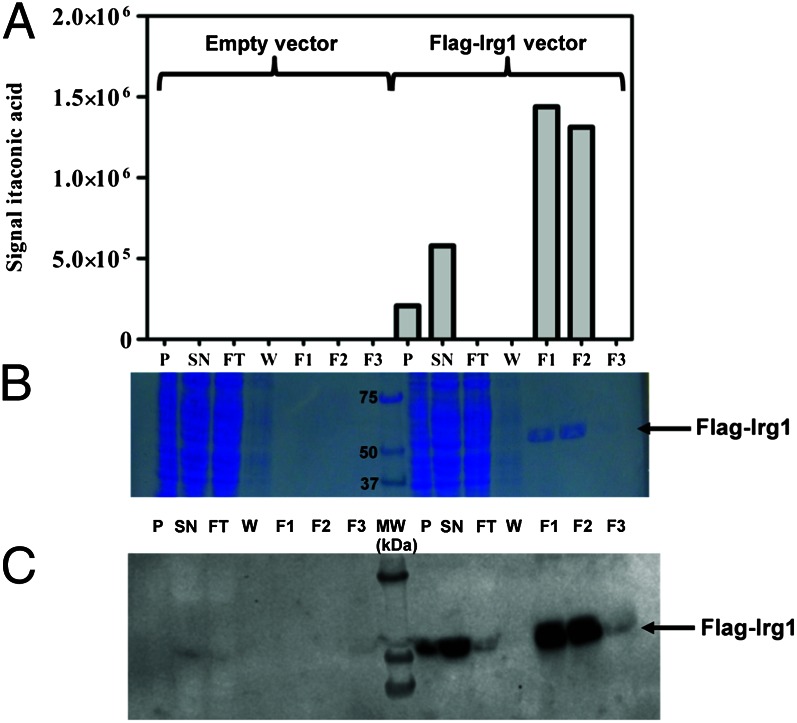
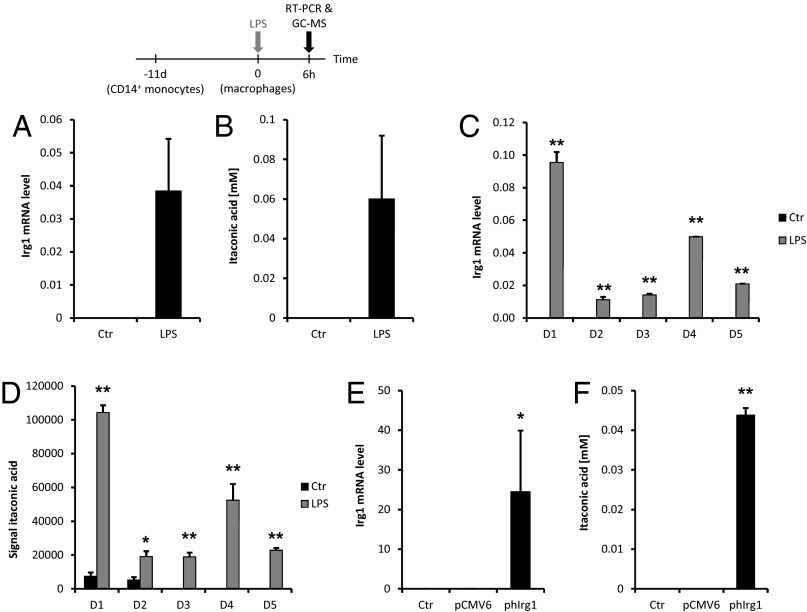
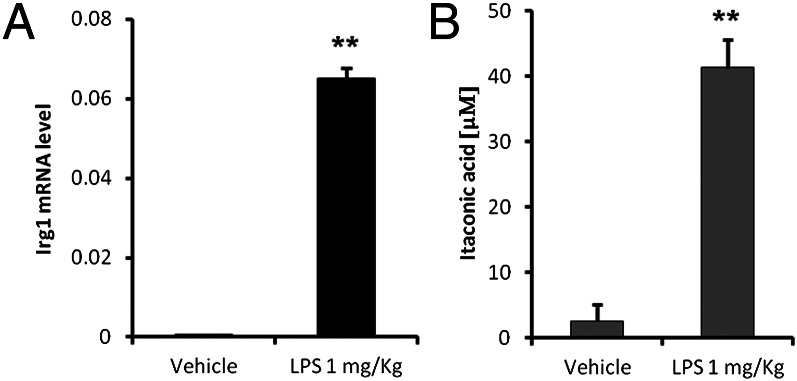
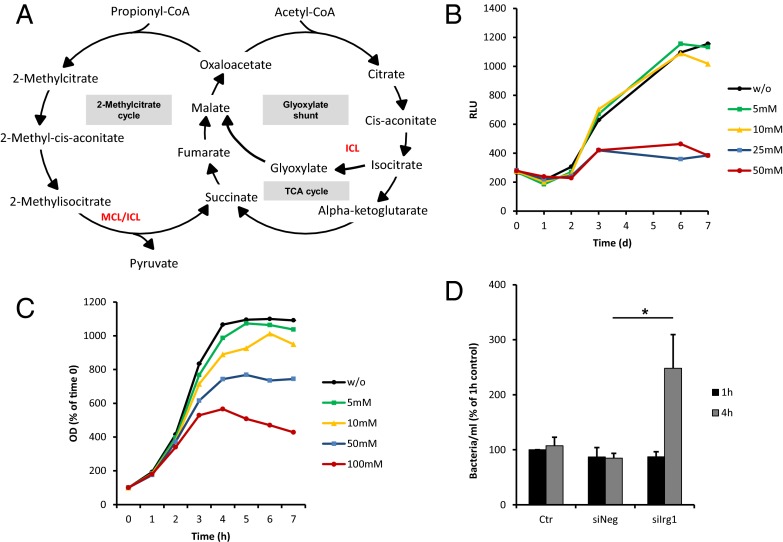
Immunoresponsive gene 1 (Irg1) is highly expressed in mammalian macrophages during inflammation, but its biological function has not yet been elucidated. Here, we identify Irg1 as the gene coding for an enzyme producing itaconic acid (also known as methylenesuccinic acid) through the decarboxylation of cis-aconitate, a tricarboxylic acid cycle intermediate. Using a gain-and-loss-of-function approach in both mouse and human immune cells, we found Irg1 expression levels correlating with the amounts of itaconic acid, a metabolite previously proposed to have an antimicrobial effect. We purified IRG1 protein and identified its cis-aconitate decarboxylating activity in an enzymatic assay. Itaconic acid is an organic compound that inhibits isocitrate lyase, the key enzyme of the glyoxylate shunt, a pathway essential for bacterial growth under specific conditions. Here we show that itaconic acid inhibits the growth of bacteria expressing isocitrate lyase, such as Salmonella enterica and Mycobacterium tuberculosis. Furthermore, Irg1 gene silencing in macrophages resulted in significantly decreased intracellular itaconic acid levels as well as significantly reduced antimicrobial activity during bacterial infections. Taken together, our results demonstrate that IRG1 links cellular metabolism with immune defense by catalyzing itaconic acid production.


Conflict of interest statement

The authors declare no conflict of interest.

Figures

Fig. 1.
Fig. 1.
(A) Levels of mRNA (left y axis, black bars) or itaconic acid (right y axis, gray bars) in resting (Ctr) or LPS-activated RAW264.7 macrophages transfected with either siRNA specific for Irg1 or with siRNA Ctr. Metabolites and RNA extractions were performed after 6 h of stimulation. The levels of Irg1 mRNA were determined by real-time RT-PCR and normalized using L27 as a housekeeping gene. Each bar represents the average expression fold change (± SD). The levels of itaconic acid were determined by GC/MS measurements. Each bar represents itaconic acid levels (± SD). *P < 0.05, **P < 0.01. (B) Itaconic acid quantification (mM) in mouse microglial cells (BV-2 cell line) and mouse macrophages (RAW264.7 cell line) after 6 h of LPS stimulation at 10 ng/mL (gray bars). Untreated cells were used as a control (black bars). Bars represent the mean of itaconic acid concentration (± SEM). **P < 0.01. Levels of mRNA (C) or itaconic acid (D) in human A549 lung cancer cells transfected with the mouse Irg1 overexpressing plasmid (pmIrg1). Metabolites and RNA extractions were performed 24 h after transfection. Real-time RT-PCR results are normalized using L27 as a housekeeping gene and are shown as average expression fold change (± SEM). *P < 0.05, **P < 0.01. (E) RAW264.7 cells were treated with LPS (10 ng/mL) at different time points and analyzed for Irg1 expression and itaconic acid concentration (mM).
Fig. 2.
Fig. 2.
(A) Synthesis pathway of itaconic acid in the TCA cycle. Itaconic acid can only contain one labeled carbon if produced in the first round of the TCA cycle (yellow-marked atoms). (B) Labeling of citric acid (black bars) and itaconic acid (gray bars) using glucose as a tracer in RAW264.7 macrophages. The major fraction of labeled itaconic acid contains one isotope, whereas citric acid contains mainly two labeled atoms.
Fig. 3.
Fig. 3.
Purification of cis-aconitate decarboxylase from HEK293T cells transfected with the pCMV6-Entry-Irg1 expression plasmid. (A) Extracts from cells transfected with empty plasmid or Flag-Irg1 plasmid were loaded onto an affinity resin (Cell MM2, FlagM purification kit, Sigma Aldrich) and proteins were eluted with Flag peptide. Cis-aconitate decarboxylase activity was measured in cell extracts and purification fractions as described in Materials and Methods. (B) A total of 12 µL of each protein fraction was loaded onto an SDS/PAGE gel that was stained with Coomassie Blue. (C) Western blot analysis of the same protein fractions was performed using an IRG1-specific antibody. F1-F3, elution fractions; FT, flow through; P, pellet; SN, supernatant; W, wash.
Fig. 4.
Fig. 4.
Human IRG1 expression and itaconic acid production. Levels of mRNA and itaconic acid in resting (Ctr) and LPS-activated (10 µg/mL) PBMC-derived macrophages. RNA and metabolites extractions were performed after 6 h of stimulation. (A) The levels of IRG1 mRNA were determined by real-time RT-PCR and normalized using L27 as a housekeeping gene. Each bar represents the average expression fold change of five different donors (± SEM). (B) The corresponding levels of itaconic acid were determined by GC/MS measurements. Each bar represents itaconic acid levels (± SEM). *P < 0.05, **P < 0.01. (C and D) Differential IRG1 gene expression analysis and itaconic acid production between five different donors. (E and F) Levels of mRNA (E) or itaconic acid (F) in human A549 lung cancer cells transfected with the human IRG1 overexpressing plasmid (phIrg1). Metabolites and RNA extractions were performed 24 h after transfection. Real-time RT-PCR results are normalized using L27 as a housekeeping gene and are shown as average expression fold change (± SEM). *P < 0.05, **P < 0.01.
Fig. 5.
Fig. 5.
Mouse peritoneal macrophages from eight saline- and seven LPS-injected mice (1 mg/kg) were isolated and pooled 24 h after i.p. injection. (A) Irg1 expression levels and (B) itaconic acid production were analyzed compared with intraperitoneally saline-injected mice. Bars represent the mean of three technical replicates (± SEM).
Fig. 6.
Fig. 6.
Effect of itaconic acid on the bacterial growth. (A) Schematic of the glyoxylate shunt and the 2-methylcitrate cycle. (B) GFP-expressing M. tuberculosis bacteria were cultured in 7H9 medium supplemented with acetate, without (w/o) or with various concentrations of itaconic acid (5, 10, 25, 50 mM). Growth was measured as relative light units (RLU) at indicated time points. Curves represent the mean of three technical replicates. (C) S. enterica was grown in liquid medium with acetate, without (w/o) or in the presence of different concentrations of itaconic acid (5, 10, 50, 100 mM). The OD was measured every hour. Curves are calculated in percent relative to time 0 and represent the mean of three independent experiments. (D) RAW264.7 cells were transfected with either siRNA specific for Irg1 (siIrg1) or with siRNA control (siNeg). After 24 h, the cells were infected with S. enterica at a multiplicity of infection of 1:10 and incubated for 1 h at 37 °C (Materials and Methods). Bars represent the mean of the numbers of bacteria per ml (± SEM) obtained from three independent experiments. *P < 0.05.

References

    1. David S, Kroner A. Repertoire of microglial and macrophage responses after spinal cord injury. Nat Rev Neurosci. 2011;12(7):388–399. - PubMed
    1. Martinez FO, Sica A, Mantovani A, Locati M. Macrophage activation and polarization. Front Biosci. 2008;13:453–461. - PubMed
    1. Mantovani A, et al. The chemokine system in diverse forms of macrophage activation and polarization. Trends Immunol. 2004;25(12):677–686. - PubMed
    1. Michelucci A, Heurtaux T, Grandbarbe L, Morga E, Heuschling P. Characterization of the microglial phenotype under specific pro-inflammatory and anti-inflammatory conditions: Effects of oligomeric and fibrillar amyloid-beta. J Neuroimmunol. 2009;210(1-2):3–12. - PubMed
    1. Tangsudjai S, et al. Involvement of the MyD88-independent pathway in controlling the intracellular fate of Burkholderia pseudomallei infection in the mouse macrophage cell line RAW 264.7. Microbiol Immunol. 2010;54(5):282–290. - PubMed

Publication types

MeSH terms