

A 4-gigabase physical map unlocks the structure and evolution of the complex genome of Aegilops tauschii, the wheat D-genome progenitor
- PMID: 23610408
- PMCID: PMC3651469
- DOI: 10.1073/pnas.1219082110
A 4-gigabase physical map unlocks the structure and evolution of the complex genome of Aegilops tauschii, the wheat D-genome progenitor
Abstract
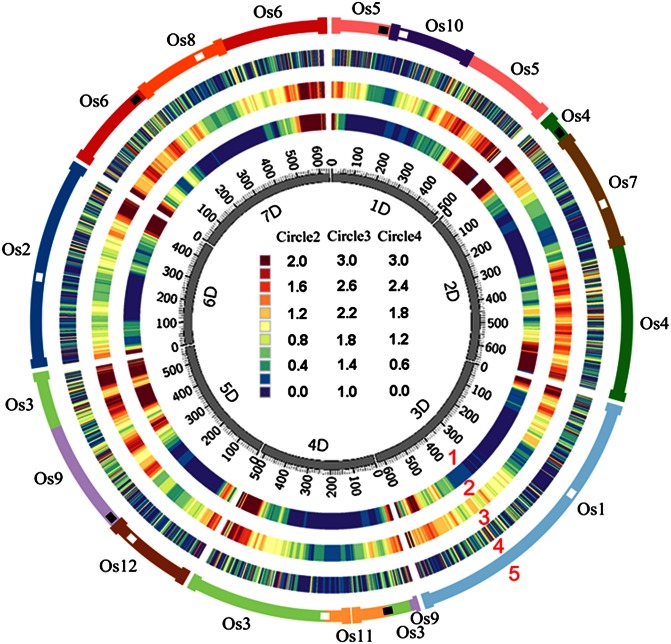
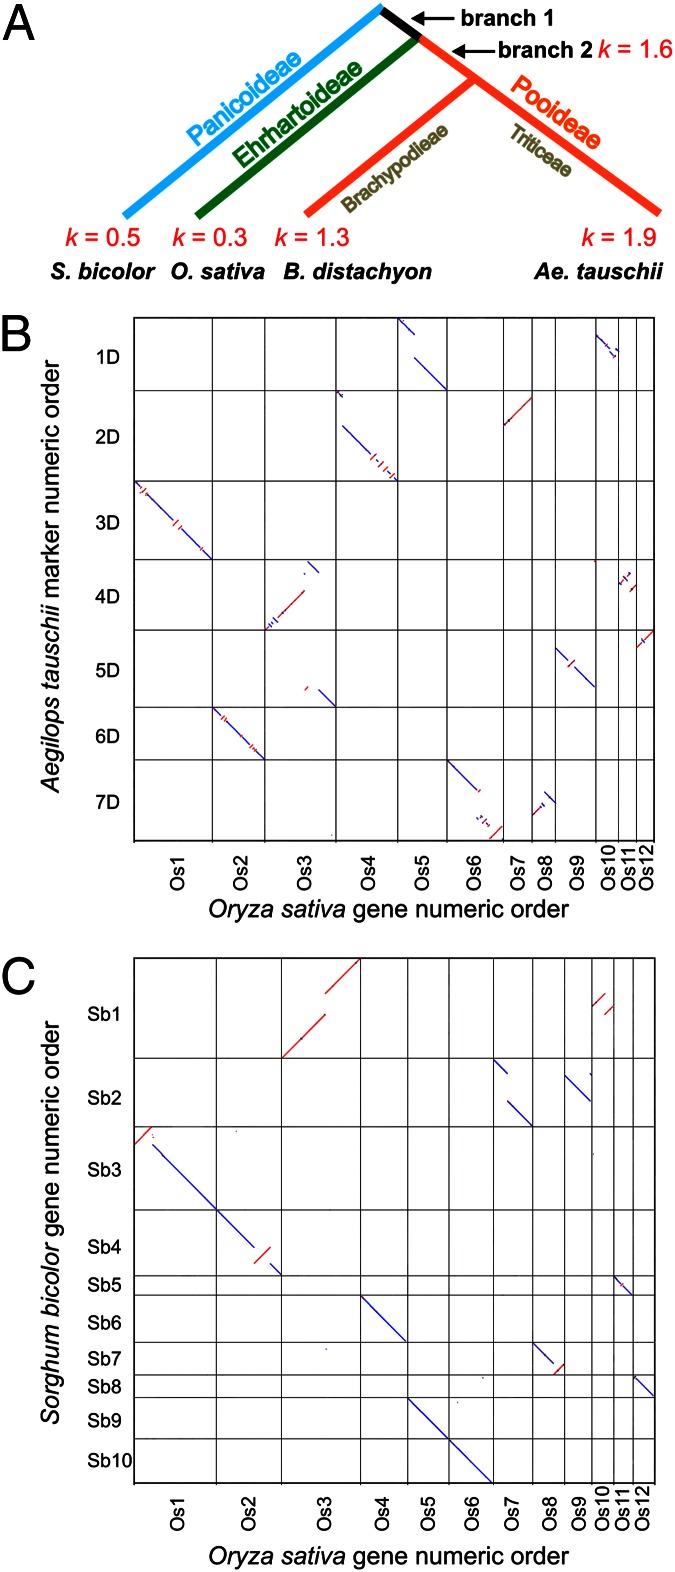
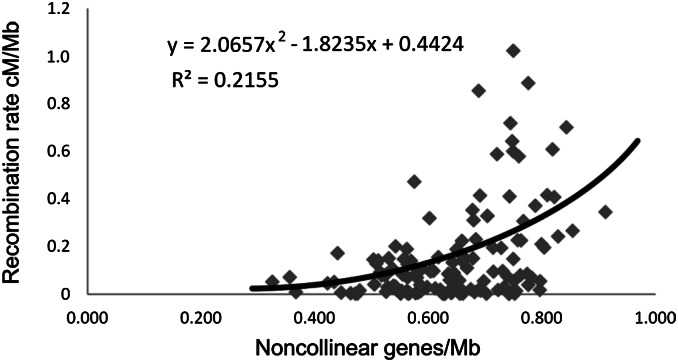
The current limitations in genome sequencing technology require the construction of physical maps for high-quality draft sequences of large plant genomes, such as that of Aegilops tauschii, the wheat D-genome progenitor. To construct a physical map of the Ae. tauschii genome, we fingerprinted 461,706 bacterial artificial chromosome clones, assembled contigs, designed a 10K Ae. tauschii Infinium SNP array, constructed a 7,185-marker genetic map, and anchored on the map contigs totaling 4.03 Gb. Using whole genome shotgun reads, we extended the SNP marker sequences and found 17,093 genes and gene fragments. We showed that collinearity of the Ae. tauschii genes with Brachypodium distachyon, rice, and sorghum decreased with phylogenetic distance and that structural genome evolution rates have been high across all investigated lineages in subfamily Pooideae, including that of Brachypodieae. We obtained additional information about the evolution of the seven Triticeae chromosomes from 12 ancestral chromosomes and uncovered a pattern of centromere inactivation accompanying nested chromosome insertions in grasses. We showed that the density of noncollinear genes along the Ae. tauschii chromosomes positively correlates with recombination rates, suggested a cause, and showed that new genes, exemplified by disease resistance genes, are preferentially located in high-recombination chromosome regions.
Keywords: BAC contig coassembly; Oryza; gene density; single nucleotide polymorphism; synteny.
Conflict of interest statement
Conflict of interest statement: W.R.M. has participated in Illumina-sponsored meetings (past 4 years) and received travel reimbursement and honorarium for presenting at these events (Illumina had no role in decisions relating to this study and the decision to publish), has participated in Pacific Biosciences-sponsored meetings (past 3 years) and received travel reimbursement for presenting at these events, and is a founder and shared holder of Orion Genomics, which focuses on plant genomics and cancer genetics.
Figures
References
-
- Arumuganathan K, Earle ED. Nuclear DNA content of some important plant species. Plant Mol Biol Rep. 1991;9(3):208–218.
-
- Rees H, Walters MR. Nuclear DNA and evolution of wheat. Heredity. 1965;20(1):73–82.
-
- Li W, Zhang P, Fellers JP, Friebe B, Gill BS. Sequence composition, organization, and evolution of the core Triticeae genome. Plant J. 2004;40(4):500–511. - PubMed
-
- Nesbitt M, Samuel D (1996) From staple crop to extinction? The archaeology and history of hulled wheats. Hulled Wheats. Promoting the Conservation and Use of Underutilized and Neglected Crops. Proceedings of the First International Workshop on Hulled Wheats, eds Padulosi S, Hammer K, Keller J (International Plant Genetic Resources Institute, Rome, Italy), pp 41–100.
Publication types
MeSH terms
Substances
Grants and funding
LinkOut - more resources
Full Text Sources
Other Literature Sources
