

Phase transition in the economically modeled growth of a cellular nervous system
- PMID: 23610428
- PMCID: PMC3651470
- DOI: 10.1073/pnas.1300753110
Phase transition in the economically modeled growth of a cellular nervous system
Abstract
Spatially embedded complex networks, such as nervous systems, the Internet, and transportation networks, generally have nontrivial topological patterns of connections combined with nearly minimal wiring costs. However, the growth rules shaping these economical tradeoffs between cost and topology are not well understood. Here, we study the cellular nervous system of the nematode worm Caenorhabditis elegans, together with information on the birth times of neurons and on their spatial locations. We find that the growth of this network undergoes a transition from an accelerated to a constant increase in the number of links (synaptic connections) as a function of the number of nodes (neurons). The time of this phase transition coincides closely with the observed moment of hatching, when development switches metamorphically from oval to larval stages. We use graph analysis and generative modeling to show that the transition between different growth regimes, as well as its coincidence with the moment of hatching, may be explained by a dynamic economical model that incorporates a tradeoff between topology and cost that is continuously negotiated and renegotiated over developmental time. As the body of the animal progressively elongates, the cost of longer-distance connections is increasingly penalized. This growth process regenerates many aspects of the adult nervous system's organization, including the neuronal membership of anatomically predefined ganglia. We expect that similar economical principles may be found in the development of other biological or manmade spatially embedded complex systems.
Keywords: C. elegans; connectome; generative model; neurodevelopment; spatial network.
Conflict of interest statement
Conflict of interest statement: E.T.B. is employed part time by GlaxoSmithKline and part time by the University of Cambridge.
Figures
 to
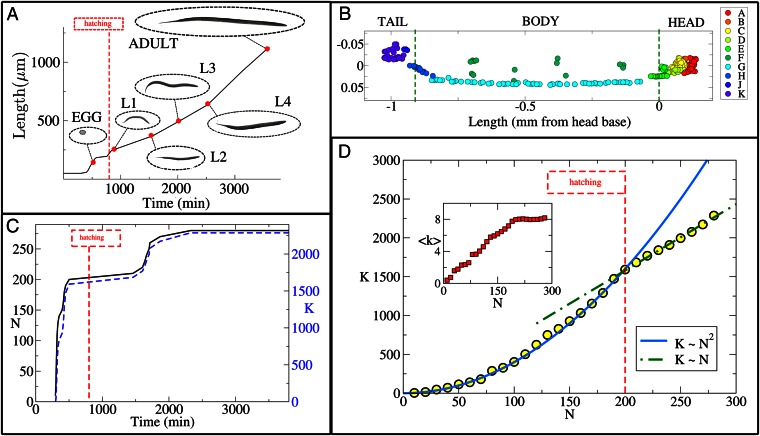
to  (–24). (B) In the adult hermaphrodite worm, more than
  of the neurons are located in the head and about
  are found in the tip of the tail (based on data modified according to ref. , axis arbitrarily centered such that the origin is at the base of the head). Neurons are colored by ganglion membership (16): anterior [A], dorsal [B], lateral [C], ventral [D], retrovesicular [E], ventral cord [G], posterior lateral [F], preanal [H], dorsorectal [J], and lumbar [K]. (C) The total number of neurons (N, solid black), and connections (K, dashed blue), grows rapidly between 250 and 500 min after fertilization. Another burst of neurogenesis is observed at the end of the L1 larval stage (using data from ref. 17). (D) Plotting the number of synapses as a function of the number of neurons (yellow ●) reveals the presence of a phase transition. Before hatching, K grows as
  (solid blue line), whereas after hatching, K grows linearly with N (dashed green line). (Inset) Plot of the average nodal degree vs. N.
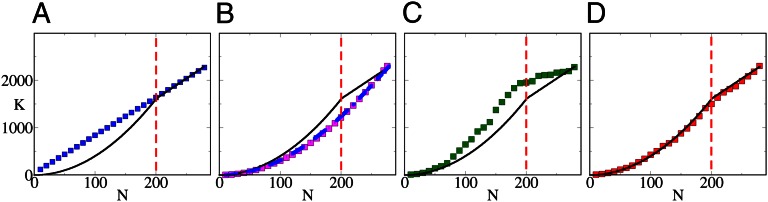
 , but fails to capture the details of the observed growth. (D) The ESTG model (red ■) accurately reproduces the details of the biphasic growth trajectory; for example, the inflection point of the modeled developmental curve corresponds closely to the moment of metamorphosis (hatching). The red dashed line in each panel indicates the number of nodes at the time of hatching
  . The SE of each growth curve is smaller than the size of the symbols used to plot it and is not reported.
References
-
- Albert R, Barabási A-L. Statistical mechanics of complex networks. Rev Mod Phys. 2002;74(1):47–97.
-
- Boccaletti S, Latora V, Moreno Y, Chavez M, Hwang D-U. Complex networks: Structure and dynamics. Phys Rep. 2006;424:175–308.
-
- Bullmore E, Sporns O. Complex brain networks: Graph theoretical analysis of structural and functional systems. Nat Rev Neurosci. 2009;10(3):186–198. - PubMed
-
- Barabási A-L. The network takeover. Nat Phys. 2012;8:14–16.
-
- Barthélemy M. Spatial networks. Phys Rep. 2011;499:1–101.
Publication types
MeSH terms
Grants and funding
LinkOut - more resources
Full Text Sources
Other Literature Sources
Research Materials
