. 2012 Nov 1;1(11):297-309.
doi: 10.1302/2046-3758.111.2000132. Print 2012 Nov.

The horse as a model of naturally occurring osteoarthritis

Affiliations

The horse as a model of naturally occurring osteoarthritis

C W McIlwraith et al. Bone Joint Res. .

Abstract

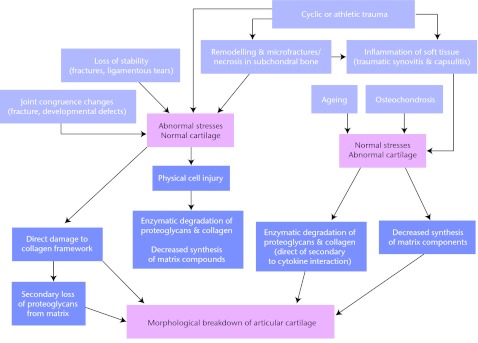
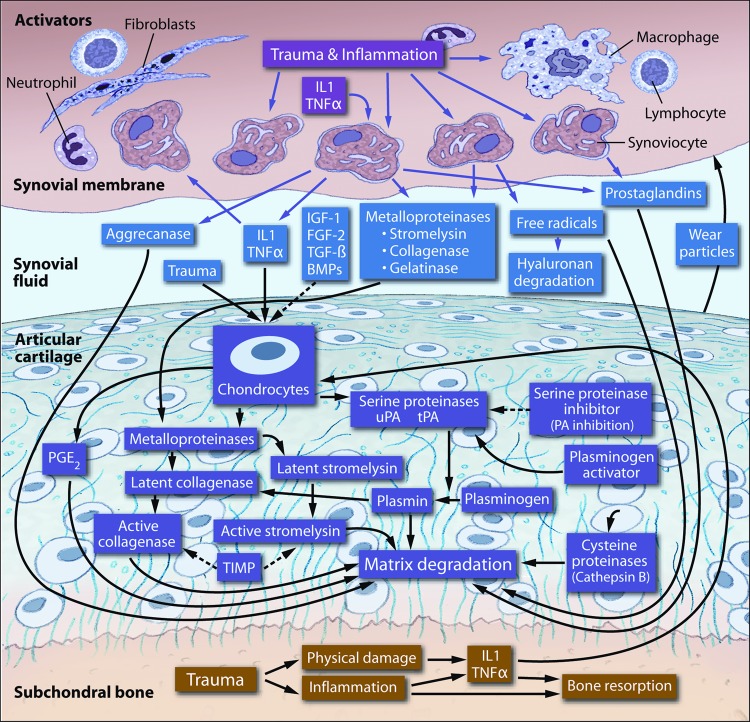
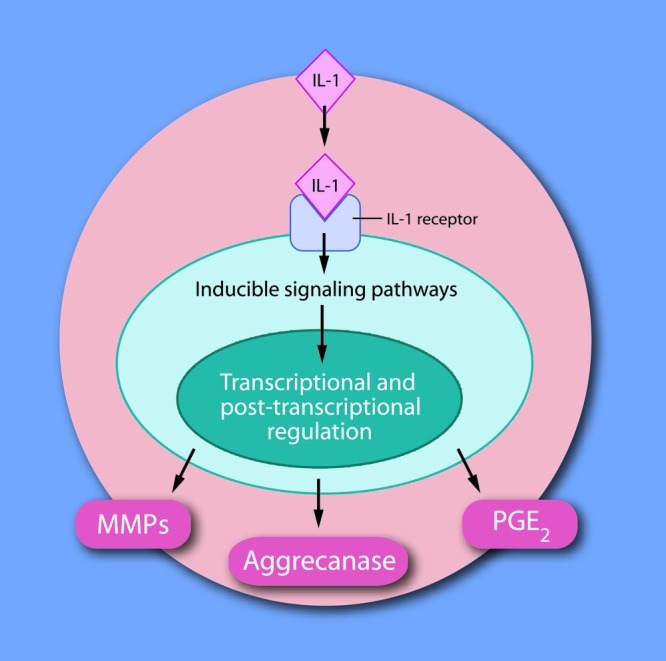
Osteoarthritis (OA) is an important cause of pain, disability and economic loss in humans, and is similarly important in the horse. Recent knowledge on post-traumatic OA has suggested opportunities for early intervention, but it is difficult to identify the appropriate time of these interventions. The horse provides two useful mechanisms to answer these questions: 1) extensive experience with clinical OA in horses; and 2) use of a consistently predictable model of OA that can help study early pathobiological events, define targets for therapeutic intervention and then test these putative therapies. This paper summarises the syndromes of clinical OA in horses including pathogenesis, diagnosis and treatment, and details controlled studies of various treatment options using an equine model of clinical OA.

Keywords: Diagnosis; Equine; Experimental model; Model; Osteoarthritis; Therapy.


Conflict of interest statement

ICMJE Conflict of Interest:None declared

Figures

Fig. 1
Fig. 1
Diagram showing the possible pathways for degradation of articular cartilage secondary to joint trauma in the horse (reproduced with permission from McIlwraith CW. Frank Milne Lecture: from arthroscopy to gene therapy: 30 years of looking in joints. Am Assoc Equine Pract 2005;51:65–113).
Fig. 2
Fig. 2
Diagram showing the factors involved in enzymatic degradation of articular cartilage matrix, Dotted lines indicate factors that may inhibit degradation (IL1, interleukin-1; TNFα, tumour necrosis factor-α; IGF-1, insulin-like growth factor-1; FGF-2, fibroblast growth factor-2; TGF-β, transforming growth factor-β; BMPs, bone morphogenetic proteins; PG, prostaglandin; PLA2, phospholipase A2; uPA, urokinase plasminogen activator; tPA, tissue plasminogen activator; PA, plasminogen activator; PGE2, prostaglandin E(2); TIMP, tissue inhibitor of metalloproteinases) (reproduced with permission from McIlwraith CW. Frank Milne Lecture: from arthroscopy to gene therapy: 30 years of looking in joints. Am Assoc Equine Pract 2005;51:65–113).
Fig. 3
Fig. 3
Diagram of interleukin-1 (IL-1) activating matrix metalloproteinases (MMPs), aggrecanase and prostaglandin E2 (PGE2) release acting through IL-1 receptors on the cell membrane (reproduced with permission from McIlwraith CW. Frank Milne Lecture: from arthroscopy to gene therapy: 30 years of looking in joints. Am Assoc Equine Pract 2005;51:65–113).
Fig. 4
Fig. 4
Arthroscopic images of a) the medial aspect of middle carpal joint, showing erosion of articular cartilage and osteophytosis on radial carpal bone, and minor cartilaginous disease on the opposing surface of the third carpal bone, b) the metacarpophalangeal joint, showing wear line formations signifying early osteoarthritis on the distal metacarpus, c) the metacarpophalangeal joint, showing focal cartilage erosion on the medial condyle of the distal metacarpus, and d) the middle carpal joint, showing severe erosion of articular cartilage on the distal radial carpal bone.
Fig. 5
Fig. 5
Image showing the dorsal view of the equine middle carpal joint depicting areas of specific tissue sampling and the osteochondral fragment: a) an area from which articular cartilage was harvested for estimation of proteoglycan synthesis, b) areas from which articular cartilage was harvested for analysis of glycosaminoglycan content, and f) areas from which articular cartilage was harvested for histopathology. The filled in area in the radial carpal bone (CR, circled) represents the osteochondral fragment and the solid lines running through this region represent the section of bone harvested for routine histopathology. The arthroscopic image shows the radial carpal bone after fragment creation and bone debridement (CI, intermediate carpal bone; CU, ulnar carpal bone; C2, second carpal bone; C3, third carpal bone; C4, fourth carpal bone) (reproduced with permission from Frisbie DD et al. Treatment of experimental equine osteoarthritis by in vivo delivery of the equine interleukin-1 receptor antagonist gene. Gene Therapy 2002;9:12–20).
Fig. 6
Fig. 6
Bar charts showing the effect of gene transfer 70 days after surgery on lameness score (left) and the synovial effusion score (right). Different letters indicate a statistical difference (p < 0.05) between bars. Alternatively when bars have the same letter, as for example in the untreated and treated normal joints, there is no significant difference between these. Lines with an asterisk (*) linking treatment groups also indicate a statistical difference between treatment groups. Comparisons marked with (*) showing significant differences equate with letters on the bars being different (reproduced with permission from Frisbie DD et al. Treatment of experimental equine osteoarthritis by in vivo delivery of the equine interleukin-1 receptor antagonist gene. Gene Therapy 2002;9:12–20).
Fig. 7
Fig. 7
Diagrams showing the effect of osteoarthritis (OA) and gene transfer on cartilage erosion. Figures 7a and 7b – photographs showing the middle carpal joint highlighting third carpal bone lesions in OA joints of untreated horses (a) and those treated with adenovirus-equine interleukin-1 receptor antagonist (Ad-EqIL-1Ra) (b). Note more extensive full-thickness articular cartilage erosions in the untreated joint (a), especially in areas of the third carpal bone (2) not adjacent to the osteochondral fragment (1). Photos were taken after aseptic harvest of cartilage from the intermediate carpal bone (3). Figure 7c – bar chart showing cartilage erosion scores by treatment group. Different letters associated with bars indicate a statistical difference (p < 0.05) between bars. Lines with an asterisk (*) linking treatment groups also indicate a statistical difference between treatment groups. For instance, there is no difference between untreated and treated normal joints, but a significant difference between untreated and treated OA joints (reproduced with permission from Frisbie DD et al. Treatment of experimental equine osteoarthritis by in vivo delivery of the equine interleukin-1 receptor antagonist gene. Gene Therapy 2002;9:12–20).
Fig. 8
Fig. 8
Diagrams showing the effect of osteoarthritis (OA) and gene transfer on cartilage histology. Figures 8a and 8b – photomicrographs from 5 µm sections of OA articular cartilage stained with Safranin-O and fast green (SOFG) in a) an OA joint of an untreated horse, showing little or no stain uptake in all areas, and b) an OA joint of a horse treated with Ad-EqIL-1ra, showing moderate stain uptake patterns in all areas. Figure 8c – bar chart showing the effect of OA and gene transfer on cartilage staining scores. Different letters associated with bars indicate a statistical difference (p < 0.05) between bars. Lines with an asterisk (*) linking treatment groups also indicate a statistical difference between treatment groups. For instance, there is no difference between untreated and treated normal joints, but a significant difference between untreated and treated OA joints (reproduced with permission from Frisbie DD et al. Treatment of experimental equine osteoarthritis by in vivo delivery of the equine interleukin-1 receptor antagonist gene. Gene Therapy 2002;9:12–20).

References

    1. Anderson DD, Chubinskaya S, Guilak F, et al. Post-traumatic osteoarthritis: improving understanding and opportunities for early intervention. J Orthop Res 2011;29:802–809 - PMC - PubMed
    1. Goldring MB, Goldring SR. Osteoarthritis. J Cell Physiol 2007;213:626–634 - PubMed
    1. Loeser RF. Age-related changes in the musculoskeletal system and the development of osteoarthritis. Clin Geriatr Med 2010;26:371–386 - PMC - PubMed
    1. Lawrence RC, Felson DT, Helmick CG, et al. Estimates of the prevalence of arthritis and other rheumatic conditions in the United States. Part II. Arthritis Rheum 2008;58:26–35 - PMC - PubMed
    1. Altman RD, Abramson S, Bruyere O, et al. Commentary: osteoarthritis of the knee and glucosamine. Osteoarthritis Cartilage 2006;14:963–966 - PubMed