Clinical Trial
. 2013 May 1;54(5):3729-37.
doi: 10.1167/iovs.12-11431.

Comparison of low-abundance biomarker levels in capillary-collected nonstimulated tears and washout tears of aqueous-deficient and normal patients

Affiliations
Clinical Trial

Comparison of low-abundance biomarker levels in capillary-collected nonstimulated tears and washout tears of aqueous-deficient and normal patients

Nicole Guyette et al. Invest Ophthalmol Vis Sci. .

Abstract

Purpose: Low tear volume limits the use of nonstimulated (NS) microcapillary tear collection in aqueous-deficient (AD) patients. Adding a small amount of "washout" fluid to the eye prior to tear collection is a potentially viable alternative method for abundant proteins, but is relatively untested for low-abundance biomarkers. This study determined the feasibility of the washout (WO) method as an NS alternative for low-abundance biomarkers. NS and WO biomarker profiles were compared between AD patients and non-AD controls to determine if the two methods identify the same intergroup differences.

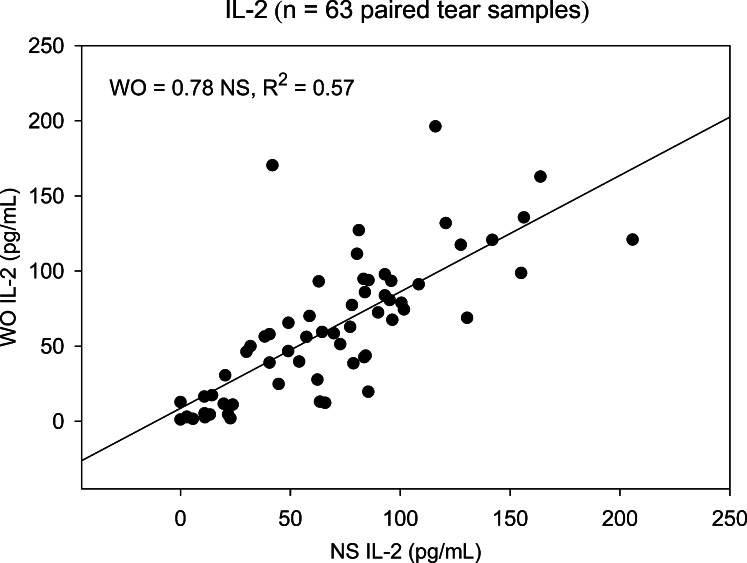
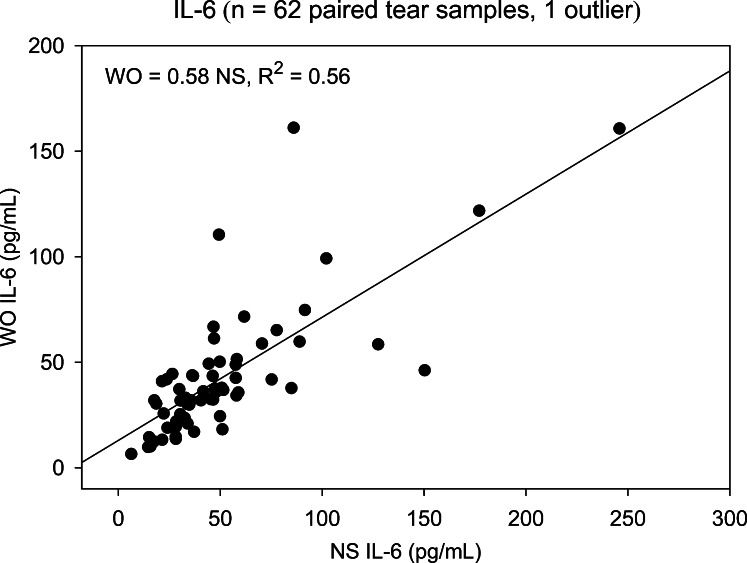
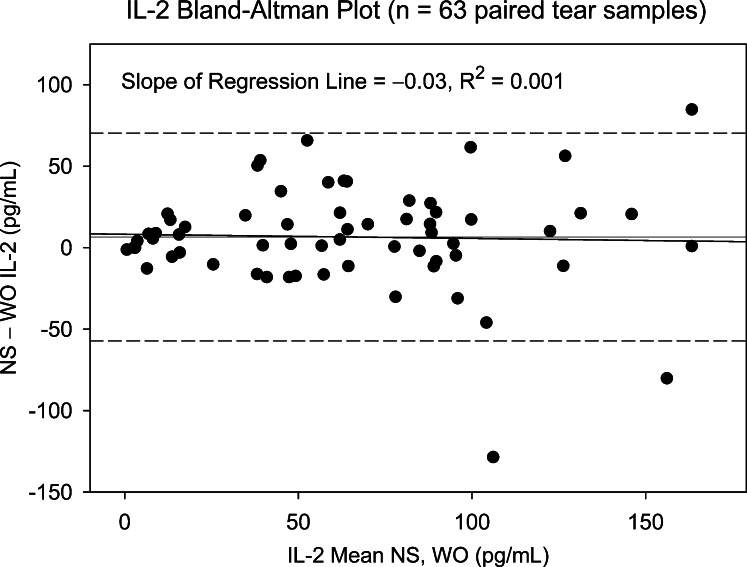
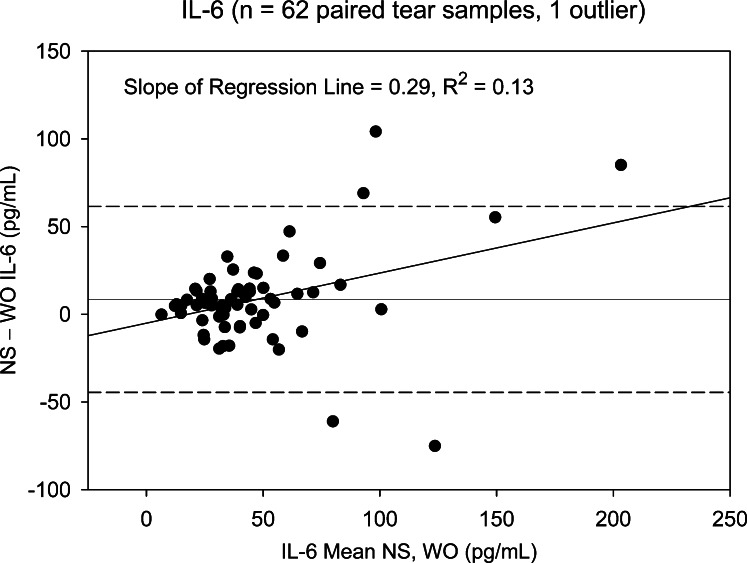
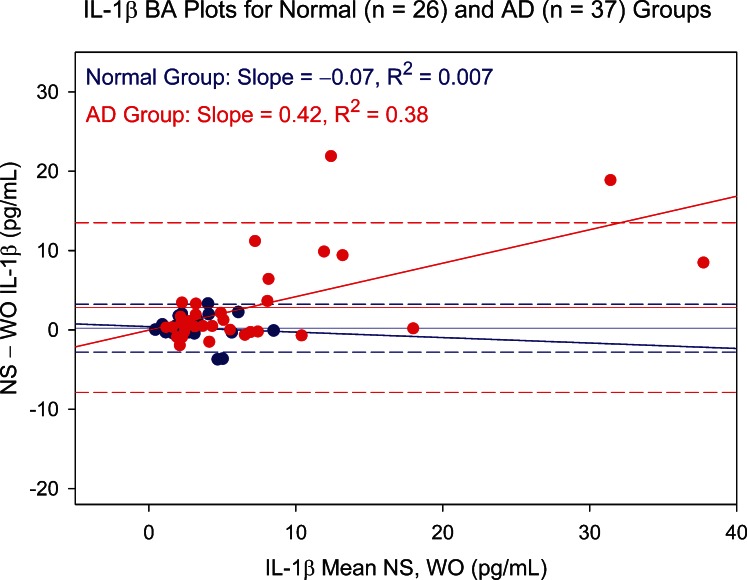
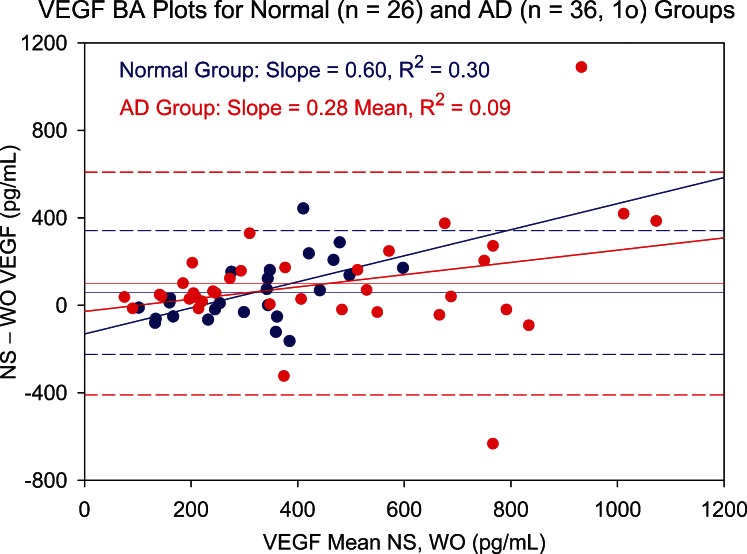
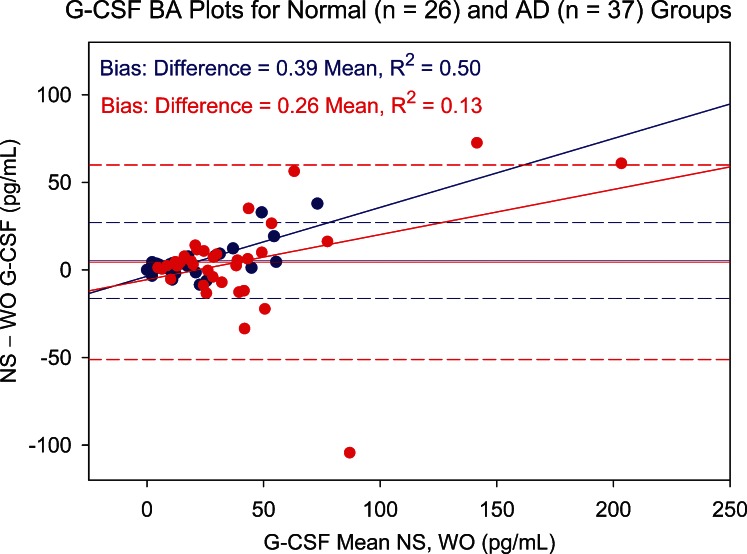
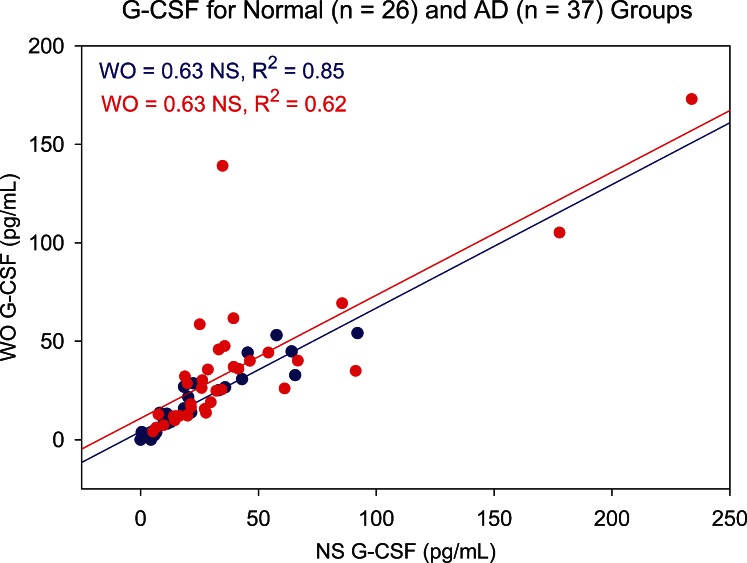
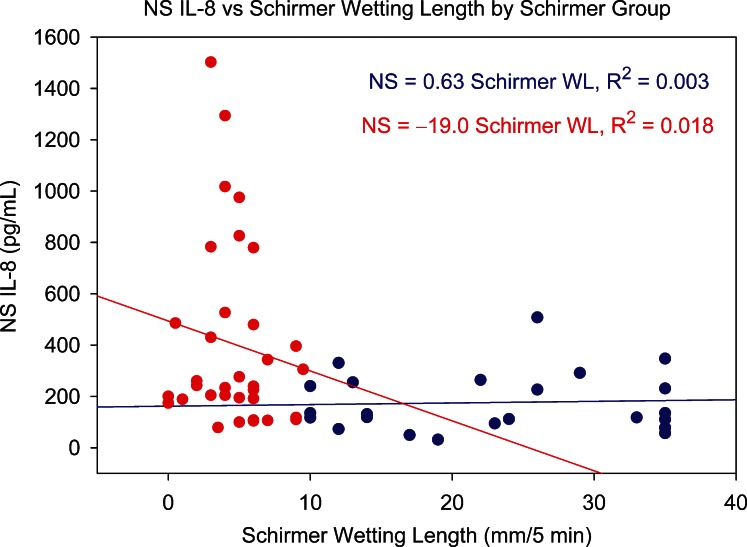
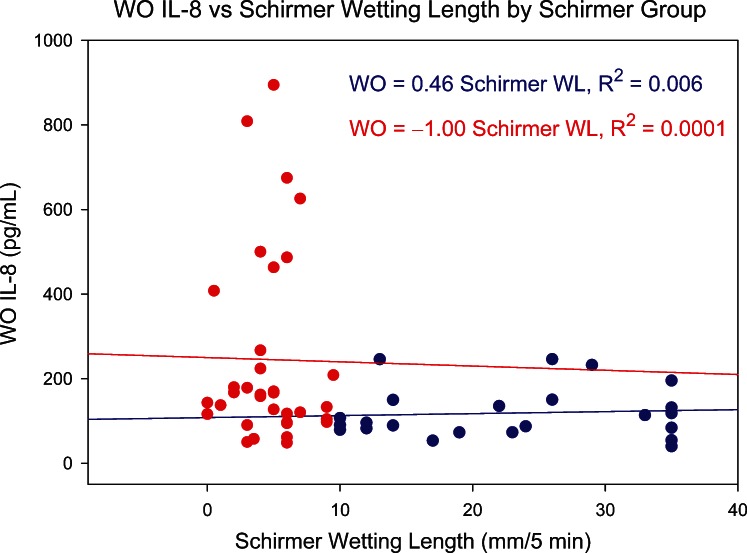
Methods: Matching NS and WO tears were collected from 48 patients by micropipette, the WO sample after instillation of 10 μL saline. Tear cytokine levels were measured by 27-Plex Bio-Rad assay. Bland-Altman analyses for each biomarker determined the agreement between tear sample types. Patients were grouped as AD or non-AD based on Schirmer score to determine if NS profile between-group differences were preserved in WO tears.

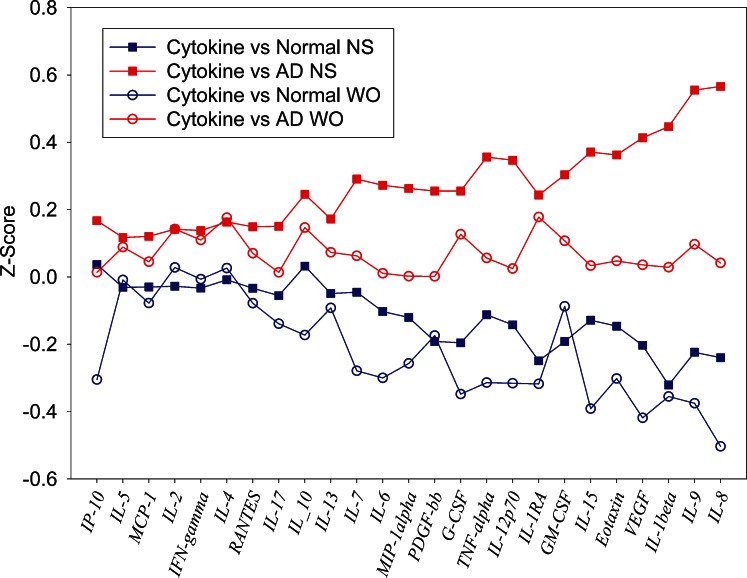
Results: Bland-Altman plots showed good biomarker level agreement between NS and WO tears for most cytokines. Five biomarkers, among those most often cited as differing in AD dry eye, differed significantly between non-AD and AD groups in both tear types. Additional biomarker differences were seen in NS tears only.

Conclusions: The WO tear collection method is a viable alternative to NS tears for many low-abundance biomarkers and is able to replicate major NS tear differences between dry eye groups. More subtle intergroup differences are lost in WO samples because of reduced statistical power.

Keywords: aqueous deficient; non-stimulated tears; tear biomarkers; washout tears.


Figures

Figure 1.
Figure 1.
Scatter plot showing the correlation between NS and WO tear levels of IL-2 for the entire patient group. Slope of the linear regression line shows that WO tear IL-2 levels averaged 78% of NS levels and correlated strongly (R2 = 0.57, P < 0.001).
Figure 2.
Figure 2.
Scatter plot showing correlation between NS and WO tear levels of IL-6 for the entire patient group. Slope of the linear regression line shows that WO tear IL-2 levels averaged 58% of NS levels with a strong correlation (R2 = 0.56, P < 0.001).
Figure 3.
Figure 3.
Bland–Altman plot showing difference between NS and WO tear IL-2 level versus mean level for paired tear samples (entire patient group). Slope of the regression plot is negligible, indicating that the difference between NS and WO levels does not vary as a function of the mean. Dashed lines represent 95% confidence limits. Three data points fall outside the Bland–Altman range for agreement between tests.
Figure 4.
Figure 4.
Bland–Altman plot showing difference between NS and WO tear IL-6 levels versus mean level for paired tear samples (entire patient group). Slope of the regression plot is positive, indicating that the difference between NS and WO levels increases as a function of the mean. Dashed lines represent 95% confidence limits. Five data points fall outside the Bland–Altman range for agreement between tests.
Figure 5.
Figure 5.
Bland–Altman (BA) plot showing NS versus WO tear levels of IL-1β for normal (blue circles) and aqueous-deficient (AD, red circles) patient groups. Difference between NS and WO tear IL-1β levels is plotted against mean level for paired tear samples. Slope of the BA plot is negligible for the normal group but shows a trend for the much more scattered aqueous-deficient group data toward an increasing difference with increasing mean. Dashed lines represent 95% confidence limits.
Figure 6.
Figure 6.
Bland–Altman (BA) plot showing NS versus WO tear levels of VEGF for normal (blue circles) and aqueous-deficient (AD, red circles) patient groups. Difference between NS and WO tear VEGF levels is plotted against mean level for paired tear samples. Slope of the BA plot is positive for both groups. Both groups show increased scatter with increasing mean VEGF level, but the effect is more pronounced for the AD group. Dashed lines represent 95% confidence limits. 1o, one outlier.
Figure 7.
Figure 7.
Tear data for each cytokine and collection method are standardized to have a mean of 0 and standard deviation of 1. This allows an equivalent determination across all cytokines of the ability to differentiate AD patients from non-AD using NS tear samples (filled symbols) and WO samples (open symbols). Cytokines are ordered on the x-axis by Z score difference between AD NS and normal NS tear samples.
Figure 8.
Figure 8.
Bland–Altman (BA) plot showing NS versus WO tear levels of G-CSF for normal (blue circles) and aqueous-deficient (AD, red circles) patient groups. Difference between NS and WO tear G-CSF levels is plotted against mean level for paired tear samples. Slope of the BA plot is positive for both groups, showing an increasing difference with increasing mean. Dashed lines represent 95% confidence limits.
Figure 9.
Figure 9.
Scatter plot showing correlation between NS and WO tear levels of G-CSF for normal (blue circles) and aqueous-deficient (AD, red circles) patient groups. Slope of the linear regression line shows that WO tear G-CSF levels averaged 63% of NS levels for both groups, correlation coefficients both being significant (P < 0.001).
Figure 10.
Figure 10.
Relationship between NS tear IL-8 level and Schirmer test score (5-minute wetting length) for normal group (blue circles) and AD group (red circles). WL, wetting length.
Figure 11.
Figure 11.
Relationship between WO tear IL-8 level and Schirmer test score (5-minute wetting length) for normal group (blue circles) and AD group (red circles). WL, wetting length.

References

    1. Research in dry eye: report of the Research Subcommittee of the International Dry Eye WorkShop ( 2007). Ocul Surf. 2007; 5: 179–193 - PubMed
    1. Fullard RJ, Snyder C. Protein levels in nonstimulated and stimulated tears of normal human subjects. Invest Ophthalmol Vis Sci. 1990; 31: 1119–1126 - PubMed
    1. Fullard RJ, Tucker D. Tear protein composition and the effects of stimulus. Adv Exp Med Biol. 1994; 350: 309–314 - PubMed
    1. Fullard RJ, Tucker DL. Changes in human tear protein levels with progressively increasing stimulus. Invest Ophthalmol Vis Sci. 1991; 32: 2290–2301 - PubMed
    1. Fullard RJ. Identification of proteins in small tear volumes with and without size exclusion HPLC fractionation. Curr Eye Res. 1988; 7: 163–179 - PubMed

Publication types