. 2013:4:1752.
doi: 10.1038/ncomms2745.

Magnetic barcode assay for genetic detection of pathogens

Affiliations

Magnetic barcode assay for genetic detection of pathogens

Monty Liong et al. Nat Commun. 2013.

Abstract

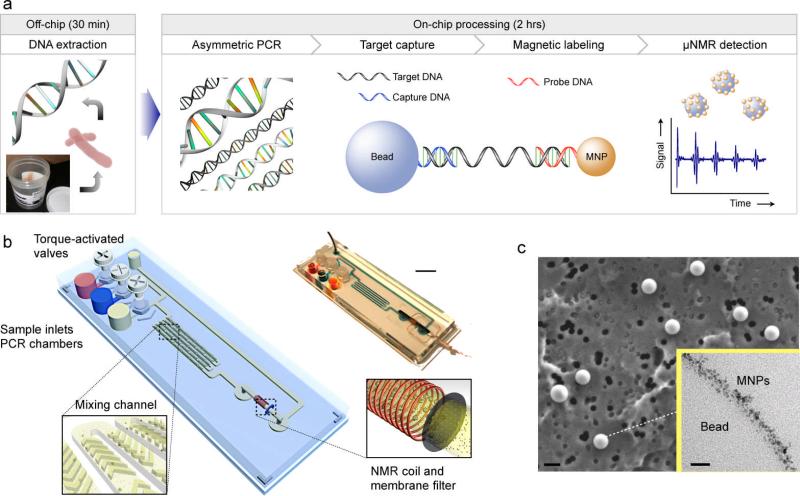
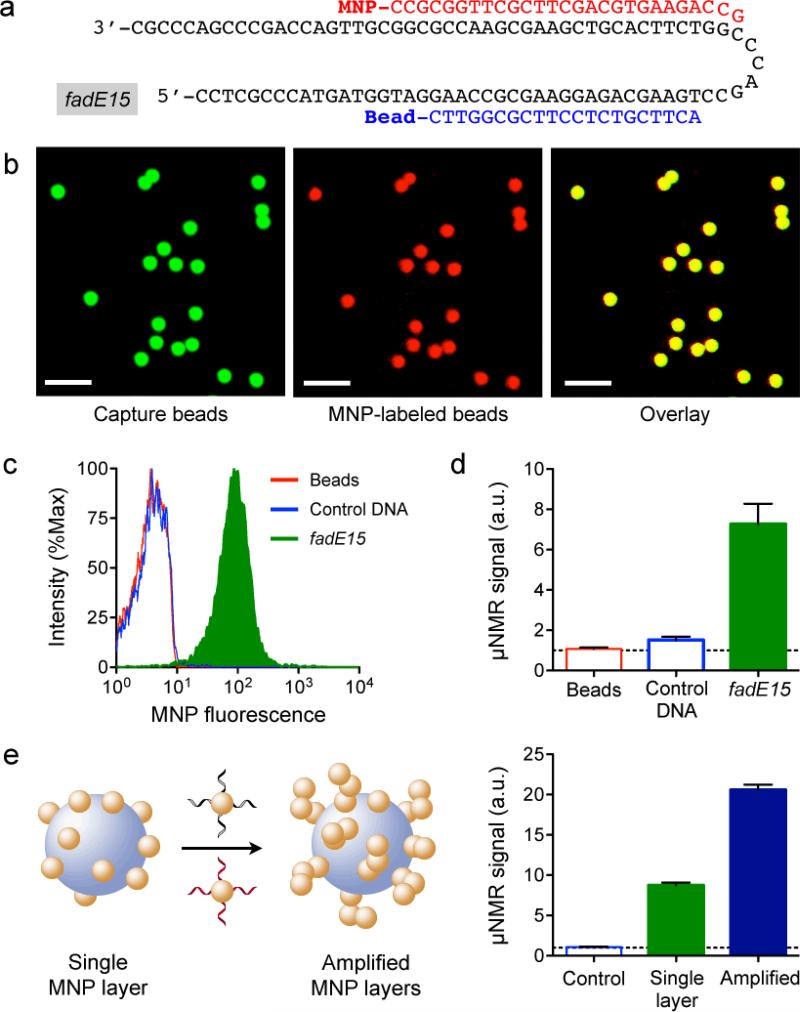
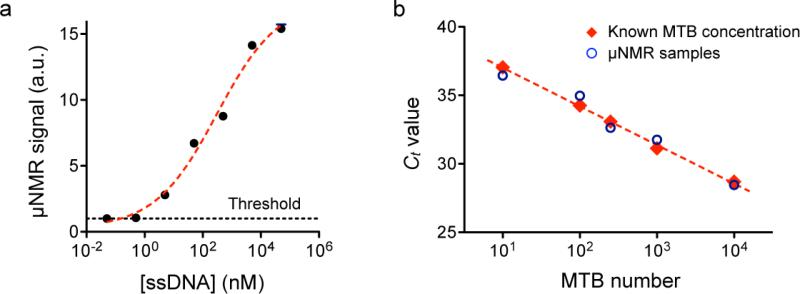
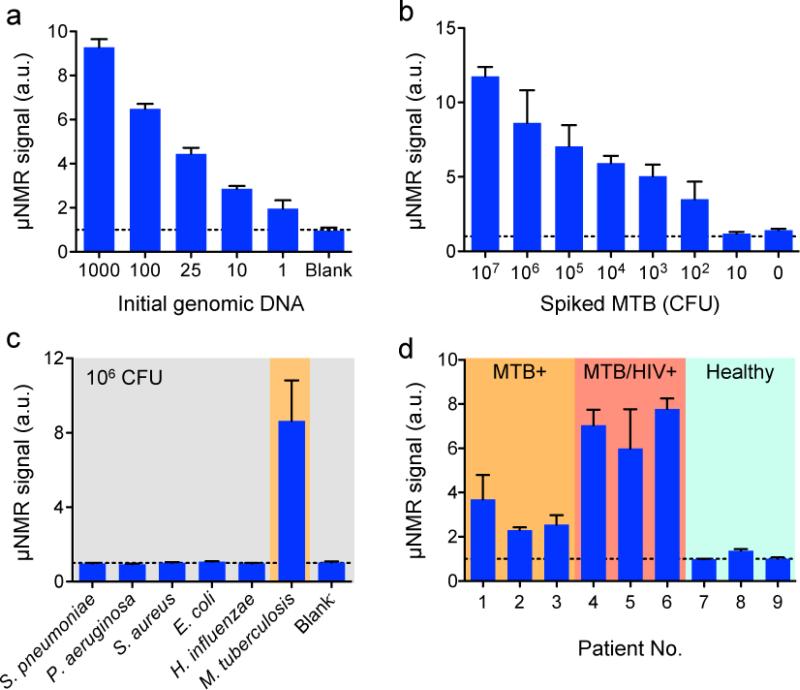
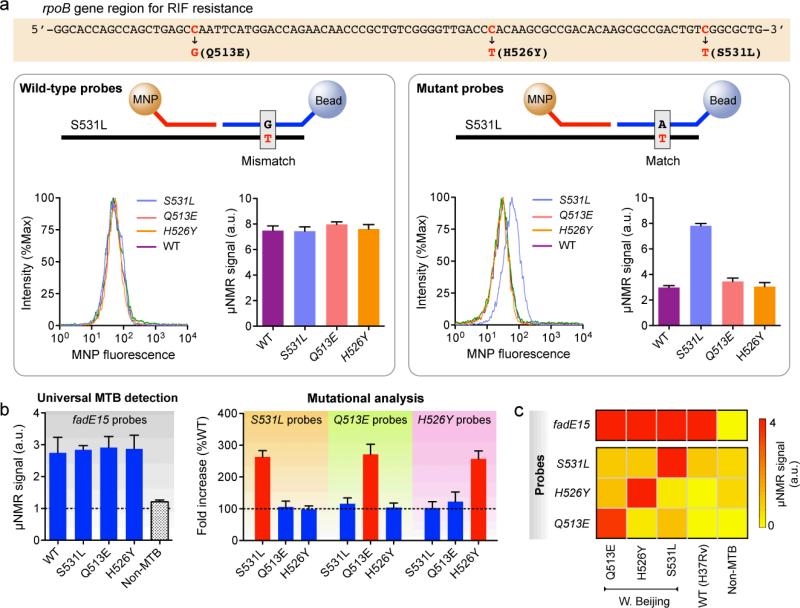
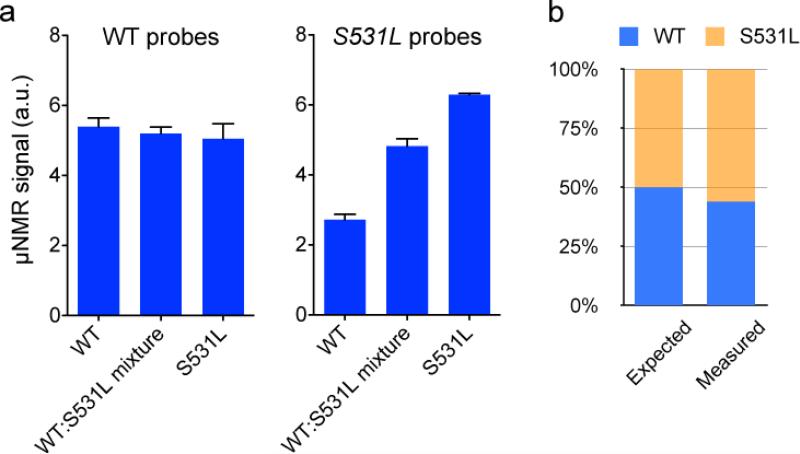
The task of rapidly identifying patients infected with Mycobacterium tuberculosis in resource-constrained environments remains a challenge. A sensitive and robust platform that does not require bacterial isolation or culture is critical in making informed diagnostic and therapeutic decisions. Here we introduce a platform for the detection of nucleic acids based on a magnetic barcoding strategy. PCR-amplified mycobacterial genes are sequence-specifically captured on microspheres, labelled by magnetic nanoprobes and detected by nuclear magnetic resonance. All components are integrated into a single, small fluidic cartridge for streamlined on-chip operation. We use this platform to detect M. tuberculosis and identify drug-resistance strains from mechanically processed sputum samples within 2.5 h. The specificity of the assay is confirmed by detecting a panel of clinically relevant non-M. tuberculosis bacteria, and the clinical utility is demonstrated by the measurements in M. tuberculosis-positive patient specimens. Combined with portable systems, the magnetic barcode assay holds promise to become a sensitive, high-throughput and low-cost platform for point-of-care diagnostics.


Figures

Figure 1
Figure 1. Magnetic barcode assay for sensitive TB detection
(a) Assay procedure. From unprocessed sputum specimen, DNA is extracted though an off-chip mechanical stressing. Extracted DNA samples are then loaded into a fluidic device for on-chip processing. The target DNA sequences are amplified by asymmetric PCR, and captured by polymer beads modified with capture DNA. Magnetic nanoprobes (MNPs) are then used to specifically coat the beads via complementary sequence, and the samples are subject to NMR measurements. The MNP-labeled beads accelerate the decay of NMR signal, providing analytical signal for nucleic acid detection. The entire assay time is ~2.5 hours. (b) A fluidic cartridge was developed to streamline the assay. The device integrates PCR chambers, mixing channels, and a microcoil for NMR measurements. The entire system was designed as a disposable unit to prevent cross-contamination of PCR-amplified products. Whole genomic DNA, extracted from expectorated samples, capture beads and MNPs are loaded into inlet chambers gated by screw valves. After on-chip PCR, magnetic labeling of the beads takes place along the mixing channel. The magnetically barcoded beads are then purified and concentrated into the μNMR probe (microcoil) by the membrane filter. Scale bar, 1 cm. (c) Scanning electron microscopy confirmed the bead capture by the membrane filter. Scale bar, 1 μm. Transmission electron microscopy revealed that beads are efficiently labeled with MNPs (inset). Scale bar, 30 nm.
Figure 2
Figure 2. Assay optimization and amplification process
(a) A segment (92-nt) of fadE15 ssDNA was used as a detection target. Capture beads and MNPs were conjugated with complementary oligonucleotides. (b) Following on-chip labeling, confocal microscopy of the magnetically barcoded beads were performed. The fluorescent polystyrene beads (green) co-localized with the near-IR fluorescence of the MNPs (red) in the presence of target fadE15 ssDNA. Scale bar, 5 μm. (c) Measurements by flow cytometry confirmed target-specific labeling of the beads. Non-complementary ssDNA samples showed low signal close to that of control. (d) Corresponding μNMR detection also displayed strong signal with the presence of fadE15 amplicons. (e) Sequential layering of the capture beads was performed using MNPs conjugated to alternating oligonucleotide sequences. Such layering amplified the number of MNP probes on the bead surface and therefore increased the overall magnetic signal. The error bars in d and e represent the standard deviation of three replicates (n = 3).
Figure 3
Figure 3. Titration assay and PCR characterization of MTB genomic DNA
(a) The detection sensitivity of the magnetic barcode assay without PCR amplification was determined. Samples containing 92-nt fadE15 ssDNA were serially diluted and magnetically labeled. The detection limit was ~1 nM of ssDNA in 1 μL sample volume. The error bars in a represent the standard deviation of three replicates (n = 3). (b) Real time PCR was used to correlate the amount of genomic DNA, and to determine the detection sensitivity. Number of genomic copies was estimated using mass calculation, assuming molecular weight of 660 per base-pair and MTB genome size of 4411529. Serial dilution of genomic DNA sample was performed to establish RT-PCR standard. Separate genomic DNA dilution was performed to contain 1, 10, 25, 100, 1000 genome, and Ct values of the samples were compared to the standard. The sample dilution was used for μNMR measurements.
Figure 4
Figure 4. MTB detection sensitivity using the magnetic barcode assay
(a) The detection limit of the platform with PCR steps was established. Genomic MTB DNA was loaded on the fluidic chip, and the 92-nt segment of fadE15 amplicons were prepared by asymmetric PCR. Titration experiments with initial DNA loading showed that the assay could detect down to a few genomic DNA in buffer solution. (b) Detection of MTB within sputum samples. Whole MTB cells were spiked into 0.5 mL aliquots of MTB-negative sputa to the final concentrations ranging from 0 to 107 CFU/mL. Following the off-chip DNA extraction, samples were measured by the magnetic barcode assay. The sensitivity was 102–103 CFU/mL. (c) Control samples containing non-MTB bacteria (106 CFU/mL) spiked into the sputa were used to confirm the specificity of the primers and barcode assay. Samples measured from the non-MTB controls displayed baseline magnetic signal, similar to the blank sputa in which no MTB was present. (d) Clinical sputum specimens were analyzed with the μNMR assay. Compared to the samples collected from MTB-positive patients, the samples collected from MTB/HIV-positive patients showed higher μNMR signals. MTB-negative sputa collected from healthy volunteers were used as negative controls. The error bars in a-d represent the standard deviation from triplicate measurements.
Figure 5
Figure 5. Magnetic detection of single-nucleotide polymorphism
(a) Magnetic barcode assay was optimized to detect point mutations in rpoB gene (Q513E, C-to-G; H526Y, C-to-T; S531L, C-to-T), which confer drug (rifampin; RIF) resistance to MTB. When the capture beads are complementary to the rpoB wild-type (WT) ssDNA, both fluorescence and magnetic readouts were indiscernible among rpoB alleles (left). When the capture DNA sequence was modified to fully match the single-nucleotide polymorphism in S531L mutant strand, the magnetic barcode assay could selectively detect the target gene (right). (b) The optimized set of magnetic barcode probes (Supplementary Fig. S5a) could effectively detect the presence of MTB (via fad15E probes) as well as analyze the mutational status (via rpoB probes). For each probe, the signal levels were normalized against that of a WT sample. The data in a and b are displayed as mean ± standard deviation from triplicate measurements. (c) Magnetic profiling on a panel of MTB strains in sputum samples. RIF-resistant W. Beijing strains and wild-type H37Rv strain were spiked in sputa (104 CFU/mL); non-MTB mixed bacteria was used as the control. Following the DNA extraction, samples were loaded onto the device for PCR and magnetically labeled. The heat map showed the universal MTB detection using the fadE15 probes as well as the sequence-specific identification of RIF-resistance with the rpoB probes.
Figure 6
Figure 6. Analysis of heterogeneous strain mixture
(a) By using the probe sequences and assay described in Supplementary Fig. S5, the 1:1 mixture of mutant S531L isolates and drug susceptible strain (106 CFU for each strain) could be detected by the magnetic barcode assay. All measurements are in triplicate, and the data are shown as mean ± standard deviation. (b) The ratio between WT and S531L population was obtained from (a). The measured ratio (WT/S531L = 56/44) was close to the expected value (50/50).

Similar articles

Cited by

References

    1. Gazdar AF. Personalized medicine and inhibition of EGFR signaling in lung cancer. N. Engl. J. Med. 2009;361:1018–1020. - PMC - PubMed
    1. Musser JM. Antimicrobial agent resistance in mycobacteria: molecular genetic insights. Clin. Microbiol. Rev. 1995;8:496–514. - PMC - PubMed
    1. Easley CJK, Karlinsey JM, et al. A fully integrated microfluidic genetic analysis system with sample-in–answer-out capability. Proc. Natl. Acad. Sci. U. S. A. 2006;103:19272–19277. - PMC - PubMed
    1. Kaigala GV, et al. Automated screening using microfluidic chip-based PCR and product detection to assess risk of BK virus-associated nephropathy in renal transplant recipients. Electrophoresis. 2006;27:3753–3763. - PubMed
    1. WHO . Global tuberculosis control: WHO Report. WHO; Geneva: 2012. 2012.

Publication types

MeSH terms