. 2013:4:1769.
doi: 10.1038/ncomms2742.

miR-155 regulates differentiation of brown and beige adipocytes via a bistable circuit

Affiliations
Free PMC article

miR-155 regulates differentiation of brown and beige adipocytes via a bistable circuit

Yong Chen et al. Nat Commun. 2013.
Free PMC article

Abstract

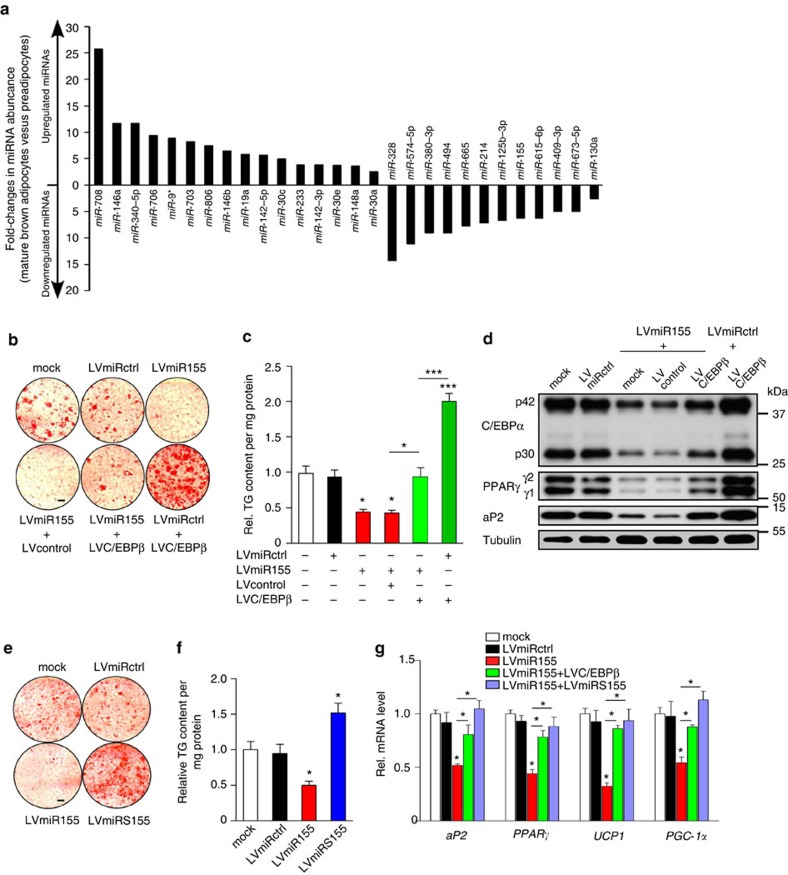
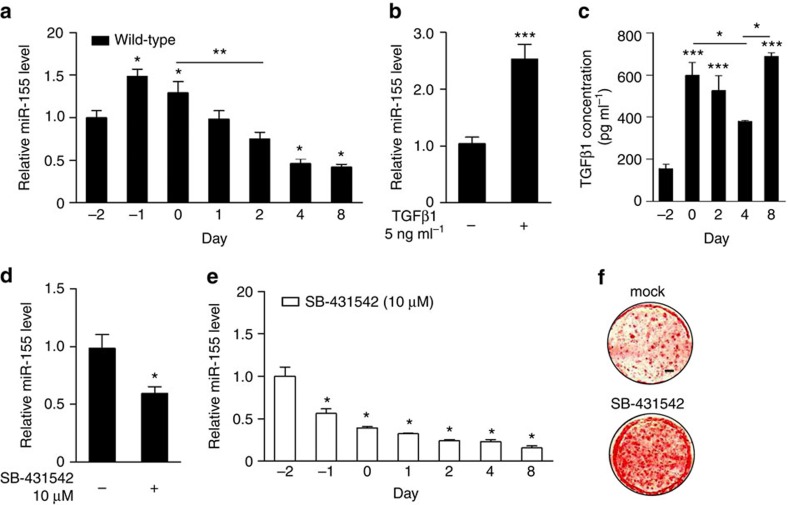
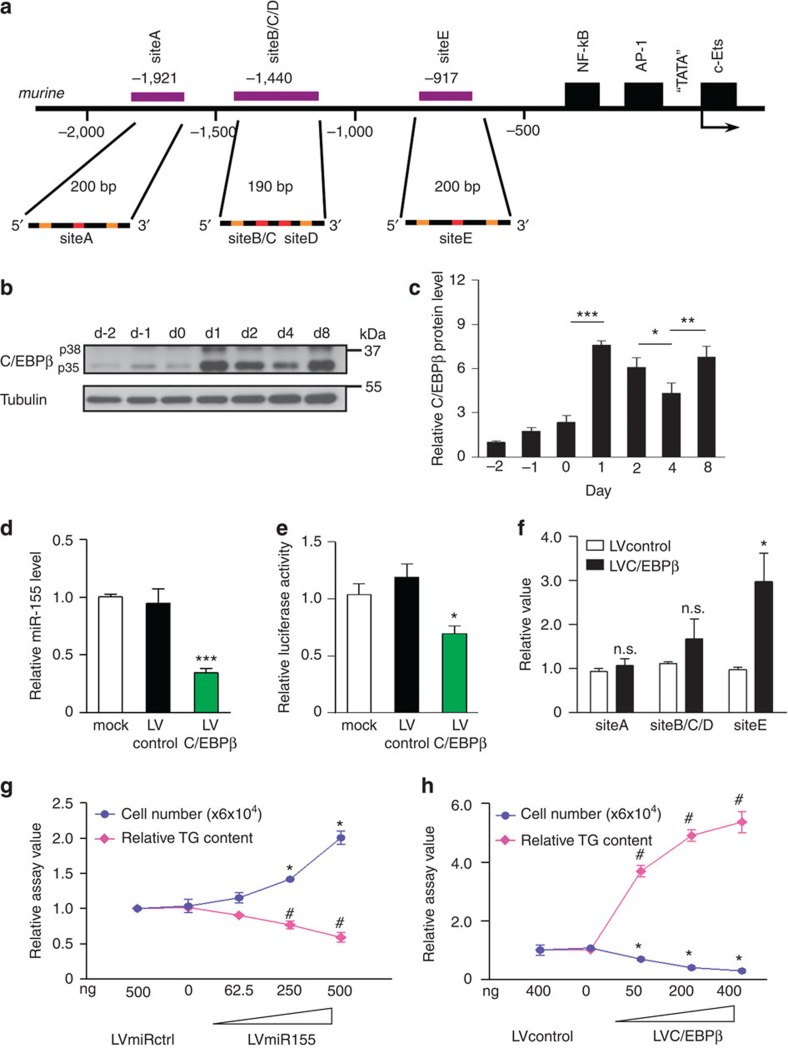
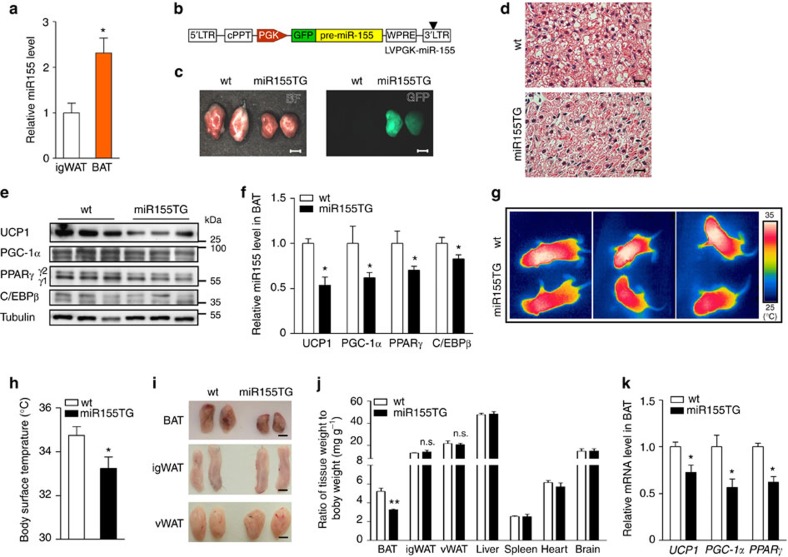
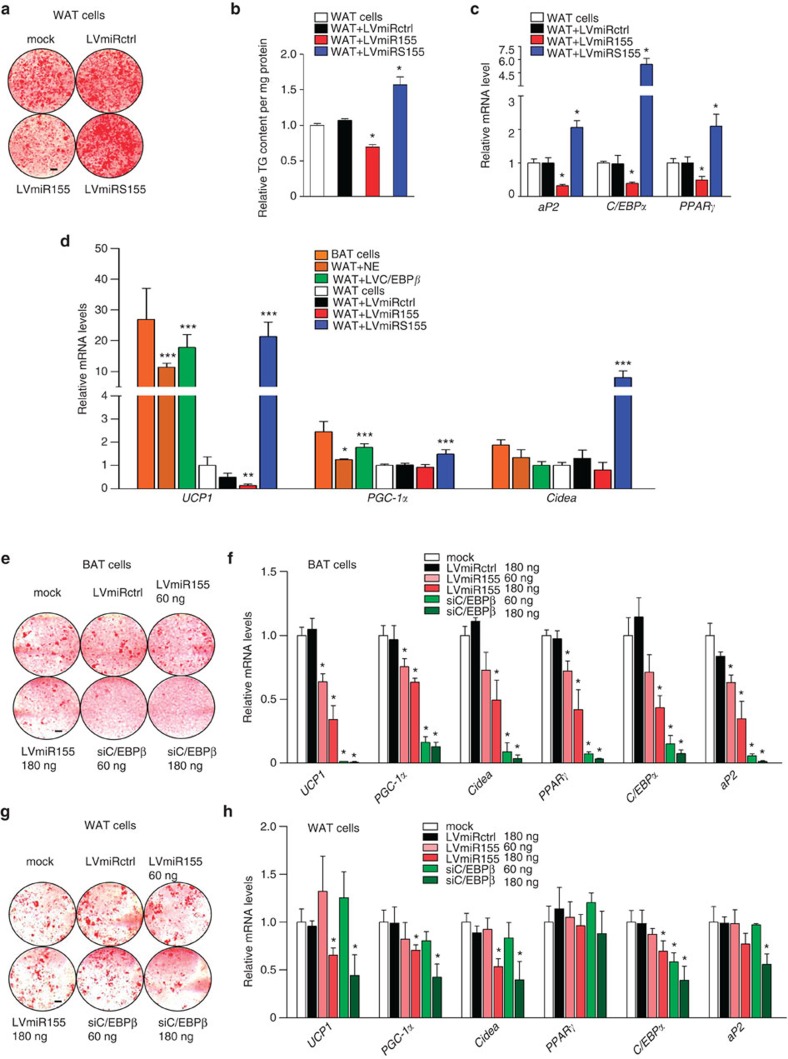
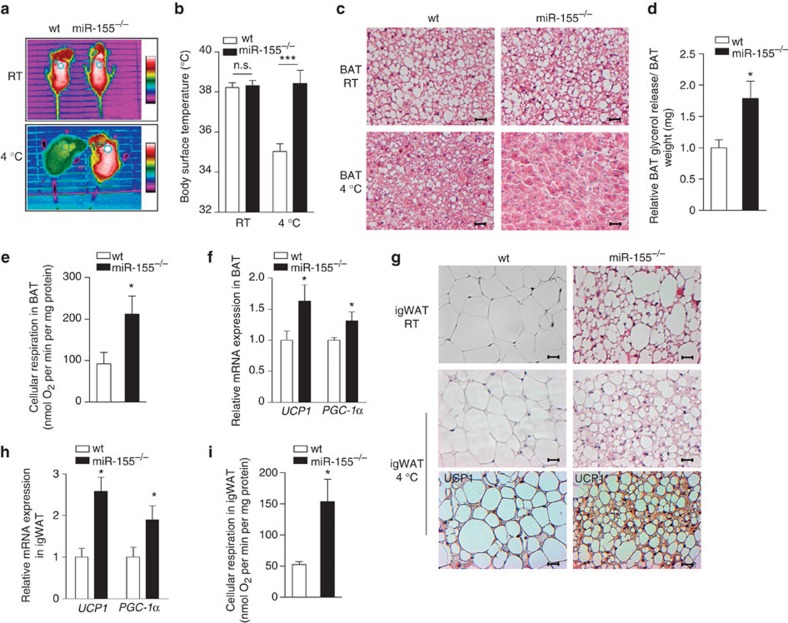
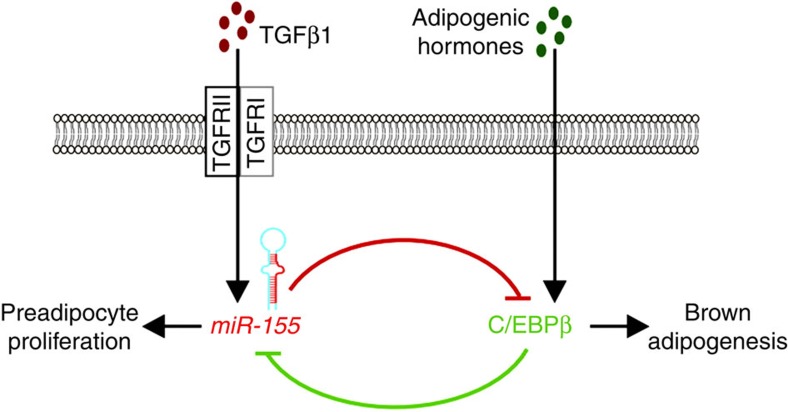
Brown adipocytes are a primary site of energy expenditure and reside not only in classical brown adipose tissue but can also be found in white adipose tissue. Here we show that microRNA 155 is enriched in brown adipose tissue and is highly expressed in proliferating brown preadipocytes but declines after induction of differentiation. Interestingly, microRNA 155 and its target, the adipogenic transcription factor CCAAT/enhancer-binding protein β, form a bistable feedback loop integrating hormonal signals that regulate proliferation or differentiation. Inhibition of microRNA 155 enhances brown adipocyte differentiation and induces a brown adipocyte-like phenotype ('browning') in white adipocytes. Consequently, microRNA 155-deficient mice exhibit increased brown adipose tissue function and 'browning' of white fat tissue. In contrast, transgenic overexpression of microRNA 155 in mice causes a reduction of brown adipose tissue mass and impairment of brown adipose tissue function. These data demonstrate that the bistable loop involving microRNA 155 and CCAAT/enhancer-binding protein β regulates brown lineage commitment, thereby, controlling the development of brown and beige fat cells.


Figures

Figure 1
Figure 1. miR-155 regulates brown fat cell differentiation via targeting C/EBPβ.
(a) Genome-wide deep sequencing screen to identify differentially regulated miRNAs in brown adipocytes. The 16 upregulated and 12 downregulated miRNAs with fold changes >2 are shown. (b) Oil Red O staining of in vitro differentiated brown adipocytes infected with different combinations of lentiviral vectors expressing miR-155 (LVmiR155) and/or C/EBPβ (LVC/EBPβ, 1 ng reverse transcriptase (RTase) of concentrated virus); mock, uninfected cells; LVmiRctrl, cells transduced with a control scrambled miRNA lentivirus; LVcontrol, empty vector. Scale bar, 3 mm. (c) TG content of in vitro differentiated brown adipocytes transduced with combinations of lentiviral vectors expressing miR-155 (LVmiR155) and/or C/EBPβ (LVC/EBPβ, 1ng RTase); mock, uninfected cells; LVmiRctrl, cells transduced with a lentivirus carrying a scrambled miRNA; LVcontrol, empty vector; TG content was normalized to total protein concentration. Untreated control was set as one. Data are represented as means±s.e.m. (*P<0.05; ***P<0.001; one-way analysis of variance (ANOVA); n=3). (d) Western Blot analysis of fat cell markers C/EBPα, PPARγ and aP2 of in vitro differentiated brown adipocytes transduced with combinations of lentiviral vectors expressing miR-155 (LVmiR155) and/or C/EBPβ (LVC/EBPβ, 1 ng RTase); mock, uninfected cells; LVmiRctrl, cells transduced with a control scrambled miRNA lentivirus; LVcontrol, empty vector. Tubulin served as loading control (representative blot out of n=3 is shown). (e) Oil Red O staining of cells overexpressing miR-155 (LVmiR155) or an anti-miR-155 sponge (LVmiRS155) as compared with cells carrying a control scrambled miRNA (LVmiRctrl); mock, uninfected cells. Scale bar, 3 mm. (f) TG content of differentiated brown adipocytes transduced with LVmiRctrl, LVmiR155 and LVmiRS155; mock, uninfected control. TG content was normalized to total protein concentration. Untreated cells were set as one. Data are represented as means±s.e.m. (*P<0.05; one-way ANOVA; n=4). (g) Abundance of adipogenic markers aP2, PPARγ as well as of thermogenic genes UCP1 and PGC-1α as measured by qRT–PCR. Untreated cells (mock) were set as one; data are presented as means±s.e.m. (*P<0.05; one-way ANOVA; n=3).
Figure 2
Figure 2. miR-155 expression is induced by TGFβ signalling during brown cell differentiation.
(a) qRT–PCR analysis of miR-155 expression levels in brown fat cells during in vitro differentiation (normalized to snoRNA202). Undifferentiated cells (day 2) were set as one. Data are represented as means±s.e.m. (*P<0.05; **P<0.005; one-way analysis of variance (ANOVA); n=5). (b) Effect of TGFβ1 (5 ng ml−1, 24 h) on miR-155 expression in brown fat cells as measured by qRT–PCR (normalized to snoRNA202 expression). Untreated cells were set as one. Data are represented as means±s.e.m. (***P<0.001; Student’s t-test; n=3). (c) TGFβ1 concentration in the cell culture supernatant during brown fat cell differentiation. Data are represented as means±s.e.m. (*P<0.05; ***P<0.001; one-way ANOVA; n=3). (d) Effect of SB-431542 (10 μM, 24 h) on miR-155 expression as measured by qRT–PCR (normalized to snoRNA202). Data are represented as means±s.e.m. (*P<0.05; Student’s t-test, as compared with untreated controls; n=3). (e) qRT–PCR analysis of miR-155 expression in in vitro differentiated brown fat cells treated with SB-431542 (10 μM, treatment day −2 to day 0) (normalized to snoRNA202). Undifferentiated cells (day −2) were set as one. Data are represented as means±s.e.m. (*P<0.05; one-way ANOVA; n=3) (f) Oil Red O staining of in vitro differentiated brown adipocytes treated with SB-431542 (10 μM, day −2 to day 0); mock, untreated cells. Scale bar, 3 mm.
Figure 3
Figure 3. miR-155 and C/EBPβ constitute a bistable feedback loop.
(a) Scheme of the 2 kb murine BIC/miR-155 promoter with the putative C/EBP-binding sites (siteA, siteB/C/D and siteE) (purple); primer binding sites, orange; C/EBP binding sites, red. (b) Representative western blot of C/EBPβ expression during in vitro brown fat differentiation. Protein samples were collected at indicated time points. Tubulin served as loading control. (c) Densitometric analysis of C/EBPβ protein levels normalized to tubulin. Data from day −2 were set as one; all data are represented as means±s.e.m. (*P<0.05; **P<0.01; ***P<0.001; one-way analysis of variance (ANOVA); n=3). (d) qRT–PCR analysis of miR-155 expression (normalized to sno202) in cells transduced with LVC/EBPβ or control virus (LVcontrol). Untreated controls (mock) were set as one; data are represented as means±s.e.m. (***P<0.001; one-way ANOVA; n=3). (e) Luciferase assay to analyse regulation of the BIC/miR-155 promoter by C/EBPβ. Cells were infected with LVcontrol or LVC/EBPβ 48 h before BIC/miR-155 promoter luciferase construct transfection. Uninfected controls (mock), transfected with the same reporter construct were set as one; data are represented as means±s.e.m. (*P<0.05; one-way ANOVA; n=4). (f) Brown preadipocytes were transduced with LVcontrol or LVC/EBPβ 48 h prior the Chromatin immunoprecipitation assay. Precipitation was performed with an anti-C/EBPβ antibody or IgG and PolII control antibodies. C/EBPβ-bound BIC/miR-155 promoter fragments were amplified using qRT–PCR primers that span putative binding sites A, B/C/D or E, respectively. Results are normalized to input values. Relative values are represented as means±s.e.m. (*P<0.05; Student’s t-test; n.s., not significant; n=3). (g,h) TG content and cell number of brown adipocytes transduced with different doses of (g) LVmiR155 (0, 62.5, 250 and 500 ng RTase per well in six-well plates) or (h) LVC/EBPβ (0, 50, 200 and 400 ng RTase per well in six-well plates). TG content was normalized to total protein concentration. LVmiRctrl-transduced cells were set as one. All data are represented as means±s.e.m. (#P<0.05; one-way ANOVA; n=3 in TG assay, *P<0.05; one-way ANOVA; n=3 in proliferation assay).
Figure 4
Figure 4. miR-155 impairs brown fat differentiation in vivo.
(a) qRT–PCR analysis for miR-155 expression in igWAT and BAT of 10-week-old male mice. Expression in igWAT was set as one; n=3. (b) Schematic representation of the lentiviral construct (LVPGK-miR-155) used for generation of miR-155 transgenic (miR155TG) animals. For abbreviations, see Supplementary Fig. S1, PGK, phosphoglycerate 1 promoter. (c) Interscapular BAT isolated from 1-week-old wt or miR155TG mice. Bright field (left) and fluorescent images (right) are shown; GFP is co-expressed with miR-155 in transgenic mice; (scale bar =2 mm). (d) Hematoxylin and eosin staining of BAT sections from 1-week-old wt and miR155TG littermates; (scale bar =15 μm). (e) Western blot analysis of UCP1, PGC-1α, PPARγ and C/EBPβ expression in BAT isolated from 1-week-old wt and miR155TG littermates; each protein levels from three representative animals per group are shown. Tubulin served as loading control. (f) Densitometric quantification of UCP1, PGC-1α, PPARγ and C/EBPβ expression levels, normalized to tubulin. Data of the wt group were set as one; n=6 per group. (g) Infrared thermographic analysis of the body surface temperature in 4-day-old wt and miR155TG littermates. Three representative pairs are showed. (h) Statistical analysis of body surface temperature in wt and miR155TG littermates; wt: 34.75±0.39 °C; miR155TG: 33.24±0.53 °C; n=5 per group. (i) Interscapular BAT, igWAT, and visceral WAT (vWAT) were isolated from 10-week-old wt or miR155TG littermates. Scale bar, 3 mm (BAT); 4 mm (igWAT and vWAT). Two representative littermates are shown. (j) Statistics of BAT, igWAT, vWAT, spleen, heart, brain and liver weights relative to total body weight in 10-week-old wt and miR155TG littermates; n=3 per group. (k) qRT–PCR analysis of brown thermogenic/adipogenic genes in interscapular BAT of wt or miR155TG littermates at 10 weeks of age: UCP1, PGC-1α and PPARγ; n=3 per group. All data are presented as means±s.e.m. (*P<0.05; **P<0.01; n.s., not significant; Student’s t-test).
Figure 5
Figure 5. miR-155 regulates the recruitment of brite fat cells.
(a) Oil Red O staining of fully differentiated WATs overexpressing miR-155 (LVmiR155) or an anti-miR-155 sponge (LVmiRS155) as compared with cells carrying a control scrambled miRNA (LVmiRctrl); mock, uninfected cells. (b) TG content of fully differentiated white adipocytes transduced with LVmiRctrl, LVmiR155 and LVmiRS155; mock, uninfected control. TG content was normalized to total protein concentration. Untreated cells were set as one. Data are represented as means±s.e.m. (*P<0.05; one-way analysis of variance (ANOVA); n=3). (c) qRT–PCR analysis of aP2, C/EBPα and PPARγ mRNA in fully differentiated white adipocytes transduced with indicated lentiviruses. Untreated cells were set as one. Data are presented as mean±s.e.m. (*P<0.05; one-way ANOVA; n=3). (d) qRT–PCR analysis of UCP1, PGC-1α and Cidea mRNA levels in differentiated white adipocytes transduced with LVC/EBPβ, LVmiR155, LVmiRS155 and LVmiRctrl or treated with 5 μM norepinephrine (NE). Differentiated BAT cells were used as positive control. Untreated white fat cells were set as one. Data were normalized to HPRT housekeeping gene expression and are represented as means±s.e.m. (*P<0.05; **P<0.01; ***P<0.001; one-way ANOVA; n=3). (e,f) Oil Red O staining (e) and qRT–PCR analysis (f) of UCP1, PGC-1α, Cidea, PPARγ, C/EBPα and aP2 mRNA of brown adipocytes (BAT cells) transduced with a low (60 ng RTase) or medium (180 ng RTase) dosage of control-miR (LVmiRctrl), miR-155 (LVmiR155) or anti-C/EBPβ siRNA (siC/EBPβ); mock, uninfected cells. Uninfected cells were set as one. Expression data are normalized to HPRT, and data are represented as means± s.e.m. (*P<0.05; one-way ANOVA; n=3). (g,h) Oil Red O staining (g) and qRT–PCR analysis (h) of UCP1, PGC-1α, Cidea, PPARγ, C/EBPα and aP2 mRNA of white adipocytes (WAT cells) transduced with with a low (60 ng RTase) or medium (180 ng RTase) dosage of control-miR (LVmiRctrl), miR-155 (LVmiR155) or anti-C/EBPβ siRNA (siC/EBPβ); mock, uninfected cells. Uninfected cells were set as one. Expression data are normalized to HPRT, and data are represented as means± s.e.m. (*P<0.05; one-way ANOVA; n=3). Scale bar, 3 mm.
Figure 6
Figure 6. miR-155 regulates cold-induced thermogenesis in BAT and ‘browning’ of WAT.
(a) Representative infrared thermographic image of 12–16-week-old male wt and miR-155−/− littermates kept at 4 °C for 4 h. (b) Statistical analysis of body surface temperature as measured by infrared thermography. Data are represented as means±s.e.m. (***P<0.001; Student’s t-test; n.s., not significant; wt group n=7, miR-155−/− group n=5). (c) Hematoxylin and eosin staining of interscapular BAT sections from wt and miR-155−/− littermates kept at room tempertaure (RT) or post cold exposure (4 °C, 4 h). Scale bar, 50 μm. (d) Lipolysis assay of BAT from 12-week-old wt and miR-155−/− littermates kept in 4 °C for 4 h. Data are represented as means±s.e.m. (*P<0.05; Student’s t-test; n=4). (e) Ex vivo oxygraph measurement of cellular mitochondrial respiration in BAT 12–16-weeks-old wt or miR-155−/− littermates exposed to 4 °C. Data are represented as means±s.e.m. (*P<0.05; Student’s t-test; wt group n=6, miR-155−/− group n=5). (f) qRT–PCR analyses of UCP1 and PGC-1α expression in BAT of 12–16-week-old wt or miR-155−/− littermates after cold exposure. Data are represented as means±s.e.m. (*P<0.05; Student’s t-test; n=4). (g) Representative hematoxylin and eosin staining of igWAT sections from wt and miR-155−/− littermates at RT or post cold exposure (top). Immunohistochemical staining for UCP1 abundance in respective igWAT sections (bottom). Scale bar, 50 μm. (h) qRT–PCR analyses of UCP1 and PGC-1α in igWAT 12–16-week-old wt or miR-155−/− littermates exposed to 4 °C for 4 h. Data are represented as means±s.e.m. (*P<0.05; Student’s t-test; wt group n=4, miR-155−/− group n=4). (i) Oxygraph measurement of cellular mitochondrial respiration in igWAT of wt and miR-155−/− littermates at 12–16 weeks of age. Data are represented as means±s.e.m. (*P<0.05; Student’s t-test; wt group n=6, miR-155−/− group n=5).
Figure 7
Figure 7. Schematic model of miR-155-regulated brown adipogenesis.
miR-155 and C/EBPβ form a self-inhibitory feedback loop that tightly regulates brown adipogenesis. miR-155 expression is induced by TGFβ1 signalling and mediates translational repression of C/EBPβ by binding to its 3′ UTR. In turn, C/EBPβ is induced by adipogenic hormones and inhibits transcription of miR-155. Thereby, miR-155 and C/EBPβ constitute a bistable system for the regulation of adipogenesis and thermogenesis by either maintaining preadipocytes in an undifferentiated precursor state (mitotic clonal expansion) or initiating the brown adipogenic program.

Similar articles

Cited by

References

    1. Enerback S.. Human brown adipose tissue. Cell Metab. 11, 248–252 (2010). - PubMed
    1. Nedergaard J. & Cannon B.. The changed metabolic world with human brown adipose tissue: therapeutic visions. Cell Metab. 11, 268–272 (2010). - PubMed
    1. van Marken Lichtenbelt W. D. et al.. Cold-activated brown adipose tissue in healthy men. N. Engl. J. Med. 360, 1500–1508 (2009). - PubMed
    1. Cinti S.. Transdifferentiation properties of adipocytes in the adipose organ. Am. J. Physiol. Endocrinol. Metab. 297, E977–E986 (2009). - PubMed
    1. Meister G. & Tuschl T.. Mechanisms of gene silencing by double-stranded RNA. Nature 431, 343–349 (2004). - PubMed

Publication types

MeSH terms

Substances

Associated data