Review
. 2013 May;28(3):178-93.
doi: 10.1097/RTI.0b013e31828d5c48.

Magnetic resonance and computed tomography imaging of the structural and functional changes of pulmonary arterial hypertension

Affiliations
Review

Magnetic resonance and computed tomography imaging of the structural and functional changes of pulmonary arterial hypertension

Mark L Schiebler et al. J Thorac Imaging. 2013 May.

Abstract

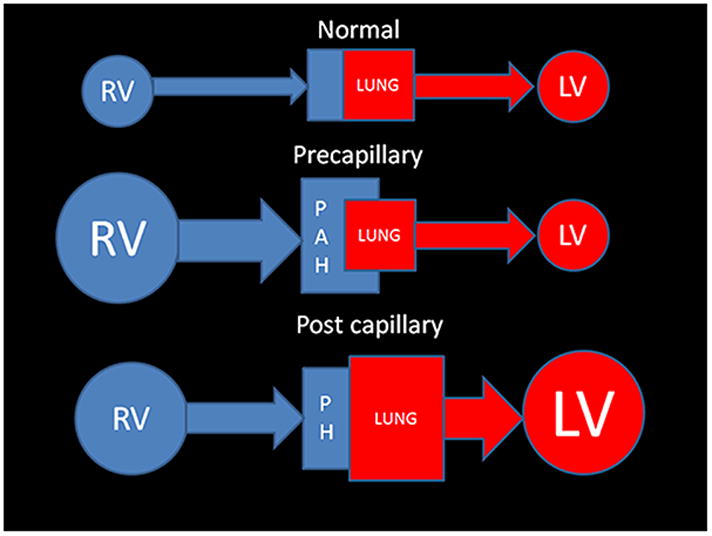
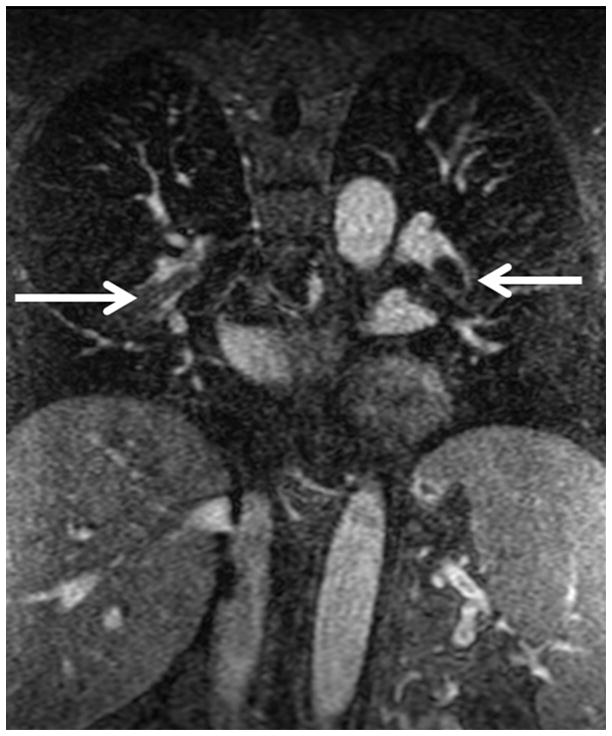
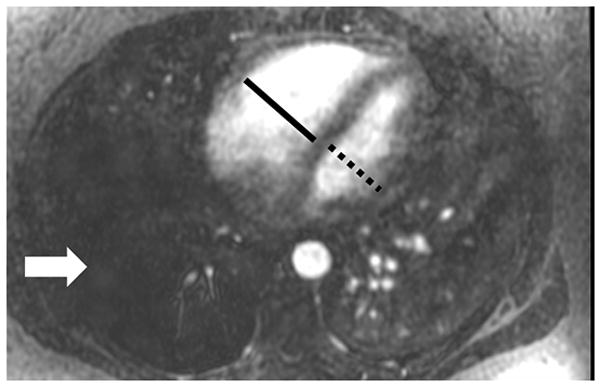
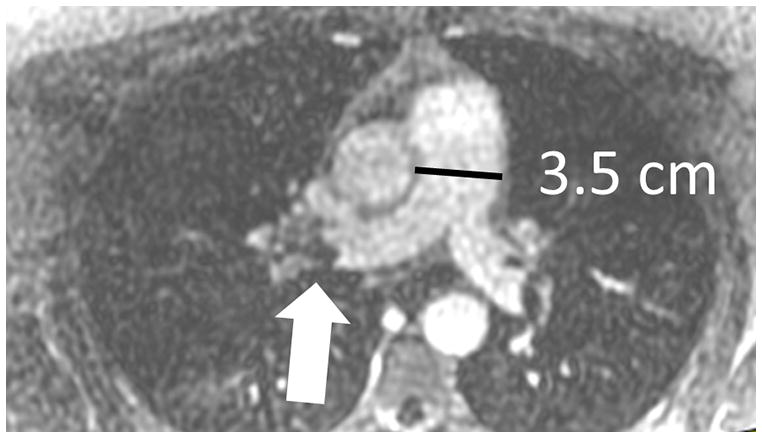
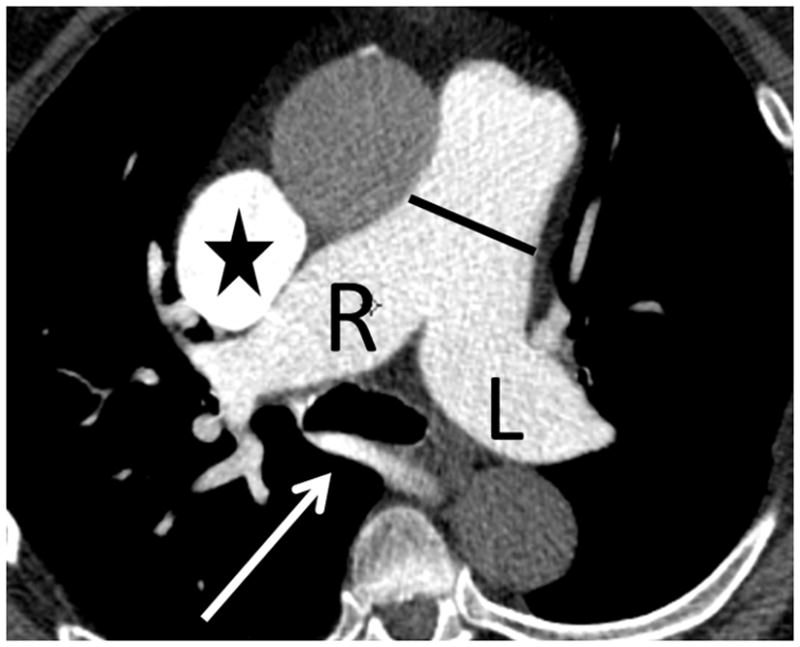
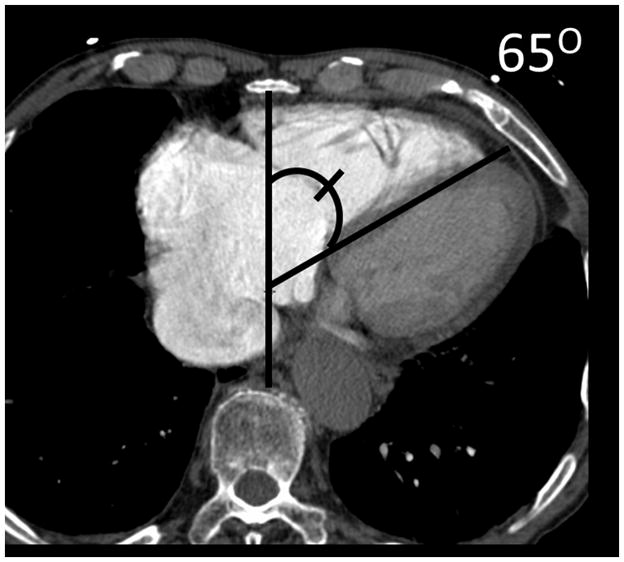
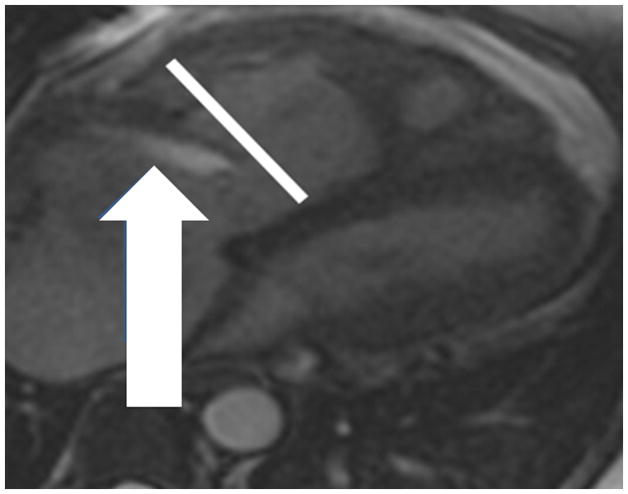
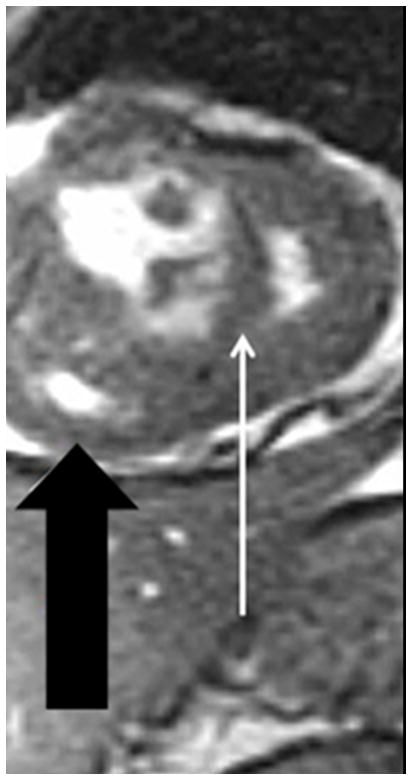
The current Dana Point Classification system (2009) distinguishes elevation of pulmonary arterial pressure into pulmonary arterial hypertension (PAH) and pulmonary hypertension. Fortunately, PAH is not a common disease. However, with the aging of the First World's population, heart failure has become an important outcome of pulmonary hypertension, with up to 9% of the population involved. PAH is usually asymptomatic until late in the disease process. Although features that are indirectly related to PAH are found on noninvasive imaging studies, its diagnosis and management still require right heart catheterization. Imaging features of PAH include the following: (1) enlargement of the pulmonary trunk and main pulmonary arteries; (2) decreased pulmonary arterial compliance; (3) tapering of the peripheral pulmonary arteries; (4) enlargement of the inferior vena cava; and (5) increased mean transit time. The chronic requirement to generate high pulmonary arterial pressure measurably affects the right heart and main pulmonary artery. This change in physiology causes the following structural and functional alterations that have been shown to have prognostic significance: relative area change (RAC) of the pulmonary trunk, right ventricular stroke volume index, right ventricular stroke volume, right ventricular end-diastolic volume index, left ventricular end-diastolic volume index, and baseline right ventricular ejection fraction <35%. All of these variables can be quantified noninvasively and followed up longitudinally in each patient using magnetic resonance imaging to modify the treatment regimen. Untreated PAH frequently results in rapid clinical decline and death within 3 years of diagnosis. Unfortunately, even with treatment, fewer than half of these patients are alive at 4 years.


Figures

Figure 1
Figure 1. Simplified fluid mechanics model for understanding the differences between Pulmonary arterial Hypertension and Pulmonary Hypertension
Normal physiology: The Qp (pulmonary blood flow) matches the Qs (systemic blood flow), thus the amount of blood entering the lungs is equal to the amount leaving the aorta. Pre capillary: Pulmonary Arterial hypertension (PAH): There is a problem in getting either normal flow (or volume) to the last order arteriole. PAH leads to back pressure which reverberates retrograde into the right ventricle. Curiously pulmonary veno- occlusive disease (which is post capillary) is categorized as a precapillary cause of PAH- 1′. Post capillary: Pulmonary Hypertension (PH): There is a limitation to the oxygenated blood’s flow from the larger pulmonary veins all the way to the aortic valve that requires an increased capillary wedge pressure. This is typically associated with left heart dysfunction and enlargement. There is secondary enlargement of the right heart and pulmonary arteries that occurs late in this form of PH. (Abbreviation Key: RV- right heart including the ventricle, atrium, and systemic veins LV- left heart including the atrium and ventricle, PAH- Pulmonary arterial hypertension, PH-Pulmonary hypertension).
Figure 2
Figure 2
Pulmonary embolism as a cause of Acute pulmonary arterial hypertension: (A) Coronal MRA showing bilateral pulmonary emboli (white arrows); (B) Right heart strain as seen on non-gated single 17 sec breath hold MRA with an increase in the short axis of the Right Ventricle (RV) as compared with the Left Ventricle (LV) and decreased perfusion of the right lower lobe (RLL); (C) Increased size of pulmonary trunk in acute PH caused by PE, Pulmonary artery diameter measurements of > 3.0 cm have some utility in suggesting the possible presence of elevated PAP; however, not all enlarged pulmonary arteries are associated with increased PAP. The pulmonary artery diameter indexed to body surface area has better sensitivity and specificity for the presence of abnormal PAP. (D) Another patient with small RLL perfusion defect from a subsegmental PE.
Figure 2
Figure 2
Pulmonary embolism as a cause of Acute pulmonary arterial hypertension: (A) Coronal MRA showing bilateral pulmonary emboli (white arrows); (B) Right heart strain as seen on non-gated single 17 sec breath hold MRA with an increase in the short axis of the Right Ventricle (RV) as compared with the Left Ventricle (LV) and decreased perfusion of the right lower lobe (RLL); (C) Increased size of pulmonary trunk in acute PH caused by PE, Pulmonary artery diameter measurements of > 3.0 cm have some utility in suggesting the possible presence of elevated PAP; however, not all enlarged pulmonary arteries are associated with increased PAP. The pulmonary artery diameter indexed to body surface area has better sensitivity and specificity for the presence of abnormal PAP. (D) Another patient with small RLL perfusion defect from a subsegmental PE.
Figure 3
Figure 3
MRA of chronic pulmonary arterial hypertension from Systemic sclerosis (A) Single 1.2 mm slice Axial 3D MRA of slightly enlarged pulmonary trunk in the setting of mild chronic PAH from Scleroderma, (B) Coronal thick slab MRA MIP of advanced PAH from Systemic sclerosis, axial thick slab MIP of advanced PAH from systemic sclerosis, (c) thick slab MIP axial MRA of advance PAH from Systemic sclerosis showing an enlarged pulmonary trunk (thick black line) at 4 cm, and a normal sized ascending aorta (dashed white line), with enlargement of both the right (dashed black line) and left main pulmonary artery(double thin black lines) (d) Sagittal thick slab double oblique thick slab MIP angled to the left lower lobe pulmonary artery (black line) of advanced PAH from systemic sclerosis showing vessel amputation and a corkscrew path (arrow) to the lung periphery.
Figure 3
Figure 3
MRA of chronic pulmonary arterial hypertension from Systemic sclerosis (A) Single 1.2 mm slice Axial 3D MRA of slightly enlarged pulmonary trunk in the setting of mild chronic PAH from Scleroderma, (B) Coronal thick slab MRA MIP of advanced PAH from Systemic sclerosis, axial thick slab MIP of advanced PAH from systemic sclerosis, (c) thick slab MIP axial MRA of advance PAH from Systemic sclerosis showing an enlarged pulmonary trunk (thick black line) at 4 cm, and a normal sized ascending aorta (dashed white line), with enlargement of both the right (dashed black line) and left main pulmonary artery(double thin black lines) (d) Sagittal thick slab double oblique thick slab MIP angled to the left lower lobe pulmonary artery (black line) of advanced PAH from systemic sclerosis showing vessel amputation and a corkscrew path (arrow) to the lung periphery.
Figure 4
Figure 4. CTAfindings in pulmonary hypertension
(a) Chronic thromboembolic pulmonary hypertension (CTEPH) with an embolus (arrow) in a subsegmental branch of the lateral segment of the right lower lobe, (b) Elevated pulmonary arterial pressure can be inferred with septal straightening (white arrow) and enlargement of the right ventricle (black arrows). There is reflux into the hepatic veins (white arrow) and inferior vena cava which is an imaging feature of elevated central venous pressure, (c) CTA from a patient with CTEPH showing circumferential chronic clot in the right main pulmonary artery (arrows). This can be removed surgically (pulmonary thromboembolectomy) with a postsurgical lowering of the mean pulmonary arterial pressure. This surgery results in an improved life expectancy for these patients, (d) Dextro- phase CTA showing an enlargement of the superior vena cava (star), pulmonary trunk (black line) and the right (R) and left (L) main pulmonary arteries with reflux into the azygous vein (white arrow), (e) CTA of pulmonary hypertension showing an increased ventricular septal angle at 65 °.
Figure 5
Figure 5. Cardiac MRI of pulmonary hypertension
(a) Chronic thromboembolic pulmonary hypertension (CTEPH) four-chamber SSFP showing a jet of tricuspid regurgitation (TR) parallel to the anterior leaflet of the tricuspid valve (arrow). The jet velocity and total flow of TR can be quantified with phase contrast MR methodology using an offline workstation. The TR jet velocity is proportional to the mean pulmonary artery pressure. The short axis of the right ventricle is increased in size (line), (b) Chronic thromboembolic pulmonary hypertension (CTEPH) short-axis SSFP showing right ventricular hypertrophy (fat arrow) and bowing of the interventricular septum (small arrow). This bowing indicates that the pressure in the right ventricle exceeds the pressure in the left ventricle at that specific time point in the cardiac cycle., (c) Dextro phase MRA showing reflux into the inferior vena cava (arrow), enlarged pulmonary trunk (PT), occlusion of left lower lobe pulmonary artery with a total lack of perfusion to the left lower lobe (bracket), and pruning of the right lung peripheral pulmonary arterial vasculature (dashed arrows).
Figure 6
Figure 6. 4D flow MRI of Pulmonary arterial hypertension from partial anomalous pulmonary venous return (Dana point 1.4.4)
Images were post processed from a respiratory gated Phase Contrast Vastly Undersampled Isotropic Projection Reconstruction (PC-VIPR). These streamlines are color coded for velocity information. The individual contributions of each anomalous vein can be derived from an off line workstation with tools that convert the phase shift information to flow over the cardiac cycle for each manually selected cut-plane. The separate cut planes for the superior vena cava (SVC) and the two anomalous pulmonary veins (PAPVR1 and PAPVR2) are shown by arrows. (Post processing using Encyte performed by Phillip Kilgas and Elizabeth Nett, PhD) (Key to abbreviations: IVC- inferior vena cava, RA- right atrium, RVOT- right ventricular outflow tract).
Figure 7
Figure 7. Pulmonary perfusion in a normal volunteer
(images were not corrected for the arterial input function): (A) Approximate Mean transit time (MTT); (B) Relative pulmonary blood flow; (C) Relative pulmonary blood volume. (Images courtesy of Scott Nagle, M.D., PhD, and Laura Bell, M.S.)

References

    1. Humbert M. The burden of pulmonary hypertension. The European respiratory journal : official journal of the European Society for Clinical Respiratory Physiology. 2007;30(1):1–2. - PubMed
    1. Strange G, Playford D, Stewart S, et al. Pulmonary hypertension: prevalence and mortality in the Armadale echocardiography cohort. Heart. 2012 - PMC - PubMed
    1. Simonneau G, Robbins IM, Beghetti M, et al. Updated clinical classification of pulmonary hypertension. Journal of the American College of Cardiology. 2009;54(1 Suppl):S43–54. - PubMed
    1. Galie N, Hoeper MM, Humbert M, et al. Guidelines for the diagnosis and treatment of pulmonary hypertension: the Task Force for the Diagnosis and Treatment of Pulmonary Hypertension of the European Society of Cardiology (ESC) and the European Respiratory Society (ERS), endorsed by the International Society of Heart and Lung Transplantation (ISHLT) European heart journal. 2009;30(20):2493–2537. - PubMed
    1. Chin KM, Kim NH, Rubin LJ. The right ventricle in pulmonary hypertension. Coronary artery disease. 2005;16(1):13–18. - PubMed

MeSH terms